Impact of virtual reality use on the teaching and learning of vectors
 Esmeralda Campos
 Irving Hidrogo
 Genaro Zavala
- 1Institute for the Future of Education, Tecnologico de Monterrey, Monterrey, Nuevo León, Mexico
- 2Innovation in Educational Technology, Tecnologico de Monterrey, Monterrey, Nuevo León, Mexico
- 3Institute for the Future of Education, School of Engineering and Sciences, Tecnologico de Monterrey, Monterrey, Nuevo León, Mexico
- 4School of Engineering, Universidad Andres Bello, Santiago, Chile
The use of virtual reality in education has enabled the possibility of representing abstract concepts and virtually manipulating them, providing a suitable platform for understanding mathematical concepts and their relation with the physical world. In this contribution, we present a study that aims to evaluate the students’ experience using a virtual reality (VR) tool and their learning of three-dimensional vectors in an introductory physics university course. We followed an experimental research design, with a control and an experimental group, for measuring students’ performance in a pre-post 3D vectors questionnaire. We surveyed the experimental group about their perception of VR use regarding their learning objectives, their experience using VR as a learning tool during the sessions, and the value of using VR in class. We found that on the items in which visualization was important, students in the experimental group outperformed the students in the control group. Students evaluated the VR tool as having a positive impact on their course contents learning and as a valuable tool to enhance their learning experience. We identified four hierarchical categories in which students perceived the use of virtual reality helped them learn the course contents: Visualization, 3D Visualization, Identification, and Understanding. Overall, this study’s findings contribute to the knowledge of using virtual reality for education at the university level. We encourage university instructors to think about incorporating VR in their classes.
Introduction
Over the last decade, several universities with the common goal of pushing educational innovation forward have invested in centers for educational innovation with a focus on emerging technologies (Hidrogo et al., 2020a). Some of the most popular emerging educational technologies are virtual reality, blockchain, internet of things, artificial intelligence, among others. Particularly, virtual reality is in a crucial moment to be implemented massively, due to several reasons. Some characteristics of virtual reality make it a favorite candidate for its application for teaching and learning in higher education; (i) as a technological tool, it can be directly applied to the teaching-learning process. (ii) Its current technological maturity stage has allowed for the development of hardware and software that can be incorporated into the educational context. At the same time, the costs have been generally reduced, making the incorporation into the educational context more viable. (iii) It can boost curiosity among students (Hidrogo et al., 2020b); and (iv) for most students, the university is the only place where they can access this technology.
Virtual environments are becoming relevant in different areas of science education, including natural, medical and computer sciences (Chou et al., 2001; Broisin et al., 2017; Paxinou et al., 2020). Many studies about the use of VR in science education focus on students’ learning outcomes, motivation, and attitude when using VR (Arici et al., 2019). The literature reports no significant differences in learning outcomes when comparing VR with other active learning experiences (Klahr et al., 2007; Moro et al., 2021), but some studies do report learning gains when comparing VR with traditional learning (Johnson-Glenberg and Megowan-Romanowicz, 2017; Liu et al., 2020). The literature on the use of VR about abilities and attitudes in science students reports improvements in students’ achievement, interests and learning experience in STEM education (August et al., 2016; Al-Amri et al., 2020). The relevance of the use of VR to improve certain scientific skills, such as visualization of abstract concepts, has been highlighted by some studies (Güney, 2019; Hite et al., 2019).
The use of virtual reality in education has enabled the possibility of representing abstract concepts and virtually manipulating them, providing a suitable platform for understanding mathematical concepts and their relationship with the physical world. Many physical quantities, such as force and acceleration, are mathematically modeled with vectors for describing, computing, and predicting the physical world. Therefore, understanding and working with vectors is necessary for learning physics. The literature highlights the benefits of using VR in science learning. Different studies have reported the development of AR applications for learning vectors, their properties, and operations (Martin-Gonzalez et al., 2016; Langer et al., 2021). In this contribution, we present a study with the objective of evaluating students’ learning and experience when using a virtual reality tool to learn about three-dimensional vectors in a university physics course. We first present a literature review on the basic concepts of virtuality and educational technology. We define the context of the study and present the research questions. We provide the methodology for the study, the description of the participants, instruments, data collection, and analysis. We present the quantitative and qualitative results and discuss the relations between them. Finally, we conclude the article with some recommendations for implementing educational technologies in the science classroom.
Literature review
When working with virtual reality (VR) it is essential to review the definitions of mixed reality, augmented reality, and virtual reality to portray our stand on these concepts. Mixed reality is a type of hybrid environment that blends the physical environment with virtual objects (Tang et al., 2020). It describes a linear continuum that ranges from real environments (reality) to fully virtual environments (virtuality) (Milgram and Kishino, 1994 as cited by Tang et al., 2020). In mixed reality, the real and virtual contents allow for data contextualization, they provide real-time interactivity, and the content needs to be mapped and correlated with the 3D space (Tang et al., 2020). Within this continuum, we find augmented reality, which integrates virtual objects into real-life environments, usually using devices such as smartphones or wearable smart glasses (Chuah, 2018). The real-life environment and the virtual objects interact through the augmented reality device in real-time (Dodevska and Mihic, 2018). For example, when taking a real-life picture with a camera on a smartphone, AR can attach virtual objects to the photograph (Sahin and Yilmaz, 2020). It has been found that augmented reality helps students to visualize abstract concepts, allowing them to observe phenomena that would be impossible otherwise (Sahin and Yilmaz, 2020).
At the end of the reality-virtuality continuum, we find virtual reality. VR blocks out the real world and creates a fully virtual setting to immerse the users into the virtual world (Chuah, 2018). Since VR represents only three-dimensional virtual environments generated with computers, it is necessary to use the appropriate hardware and software to experience VR (Dodevska and Mihic, 2018). VR is an experience in which the user is physically in the real world, entering a three-dimensional virtual environment using a headset and a computer or with a mobile device (Frost et al., 2020). The VR market nowadays has contributed to academic research, engineering, and education, among other areas (Tang et al., 2020).
To design and develop VR learning experiences, it is necessary to consider key educational process elements, such as effective pedagogy, considering the time for teaching and learning activities, using appropriate tools and resources, and promoting student engagement (Tang et al., 2020). Buentello-Montoya et al. (2021) highlighted the importance of having an adequate pedagogical design when implementing VR and AR in the learning of mathematics. Research has found that virtual learning environments can enhance, motivate, and stimulate learning that the traditional approach could not achieve easily (Pan et al., 2006 as cited by Tang et al., 2020). Educational technologies can improve science courses by implementing effective scientific activities and bringing students closer to abstract situations that are difficult to recognize in real life (Sahin and Yilmaz, 2020). The development of virtual experiences in science teaching should be designed to enhance student learning and motivate positive attitudes in students.
Dodevska and Mihic (2018) highlight some advantages and disadvantages of using VR. As advantages, VR can help make decisions in complex projects, reduce time and efficiency, and provide simulations that could lower costs and improve experiences. The main disadvantages are that the initial costs of the hardware and software requirements and changing platforms may not be quite straightforward.
Virtual and augmented reality in science education
Virtual environments are becoming relevant for science education in different areas, such as computer science education (Broisin et al., 2017), nanotechnology education (Xie and Lee, 2012; Schönborn et al., 2016), biology education (Poland et al., 2003; Paxinou et al., 2020), building sciences education (Setareh et al., 2005), health science education (Chou et al., 2001), chemistry education (Miller et al., 2021), among others. Research suggests that VR can be effectively implemented as a virtual class for web-based science education (Shin, 2002). Pre-service science teachers become aware of the potential advantages and disadvantages of using virtual reality within a classroom setting after using a multi-user virtual environment (Kennedy-Clark, 2011). Cowling and Birt (2018) emphasize the need to put pedagogy before the technology to create mixed-reality simulations that satisfy students’ pedagogical needs with a design-based research approach.
The trends in mixed reality studies show that most studies focus on learning achievement, motivation, and attitude and that there is a lack of qualitative research in this area (Arici et al., 2019). Most research compares students’ learning outcomes when using VR to other approaches such as AR, hands-on experiences, and/or traditional education. Research suggests that VR is more effective for visual educational content, while AR is a better option for auditory learning (Huang et al., 2019).
The research has found no significant differences in learning outcomes between VR, AR and hands-on experiences. Research has shown that hands-on activities performed in virtual and physical environments are equally effective in producing significant learning outcomes regarding learners’ knowledge and confidence in early science education (Klahr et al., 2007). Other studies have found that there is parity between using hands-on learning and virtual reality in learning outcomes and cognitive processes (Lamb et al., 2018). In the teaching of medical sciences, several studies have found that there is no significant difference in learning outcomes between using VR, AR or tablet-based simulations; however, using VR participants reported adverse effects, such as dizziness (Moro et al., 2017a,b, 2021).
However, when comparing the use of VR with traditional approaches, the literature reports learning gains. McElhaney and Linn (2011) found that students experiment with virtual environments as intentional, unsystematic and exhaustive experimenters, and that these students had significant learning gains on physics understanding. Collaborative embodied learning in mixed-reality environments leads to increased learning gains compared to regular instruction in science learning (Johnson-Glenberg et al., 2014; Johnson-Glenberg and Megowan-Romanowicz, 2017). Using whole-body, immersive simulations of critical ideas in physics leads to significant learning gains, high engagement, and positive attitudes toward science (Lindgren et al., 2016). Using VR in the science classroom improves academic achievement and engagement scores compared to traditional courses (Liu et al., 2020).
Several studies have found that the use of VR improves specific abilities and attitudes in science students. Implementing a 3D Virtual reality learning environment improved female students’ physics achievement and motivation toward physics learning (Al-Amri et al., 2020). Scherer and Tiemann (2012) found three problem-solving abilities in virtual environments, achieving a goal state, systematic handling of variables, and solving analytical tasks. Motivation and students’ learning attitudes in immersive virtual environments for science education are related through the constructs of intrinsic value and self-regulation, while students’ attention and enjoyment relate to students’ learning in the immersive virtual environment (Cheng and Tsai, 2020). Implementing a Virtual Engineering Science Learning Lab (VESLL) has proven to improve student interest and learning experience in STEM education (August et al., 2016).
Güney (2019) highlights the relevance of visualization and visual literacy in instructional design for implementing technology in learning environments through a literature review on visual effects, visual literacy, and the design of multimedia instruction. Using a haptic virtual model with visual and tactile sensorimotor interactions may provide students with the opportunity to construct knowledge about submicroscopic phenomena (Schönborn et al., 2011). Using VR environments and technology for science learning, it is essential to consider students’ spatial acuity, since the learners’ cognitive development plays an important role in students’ perception of virtual reality (Hite et al., 2019). In the learning of mathematics, Schutera et al. (2021) highlighted the relevance of using AR in developing spatial visualization when learning vectors.
Definition of the study
In this experimental study, we used PC-powered VR equipment, each one with two controllers to interact with the virtual environment. This equipment has sensors on the ceiling to enable room scale, which is the function of reflecting movements carried out in the physical world in the virtual environment. The equipment is part of the MOSTLA center, the experiential learning space for emerging technologies at Tecnologico de Monterrey. The center provides emerging technology opportunities for faculty and students at the university (Hidrogo et al., 2020b).
We used the VR commercial application Gravity Sketch, a tool for three-dimensional object design and prototyping compatible with the most popular VR systems. In this case, the VR system was HTC Vive connected to computers with Windows. For its focus on design and 3D modeling, Gravity Sketch allows the drawing and manipulating of objects through a three-dimensional grid so that it is possible to draw coordinate axes, locate the vectors in the grid, and measure the length of the vectors. It also allows drawing planes, visualizing projections of vectors in this plane, and drawing angles wherever needed. With these tools, the students could access vector models previously designed by the instructor, observe them from every angle and manipulate them to conduct measurements and computations of their dimensions, angles, and projections. Additionally, they could create their own vectors to model the physical problems they needed to solve. Figure 1A presents an example of the identification of vectors in Gravity Sketch and Figure 1B presents the students working in teams with the equipment: One student is using the VR goggles and the other students are visualizing it on the screen.
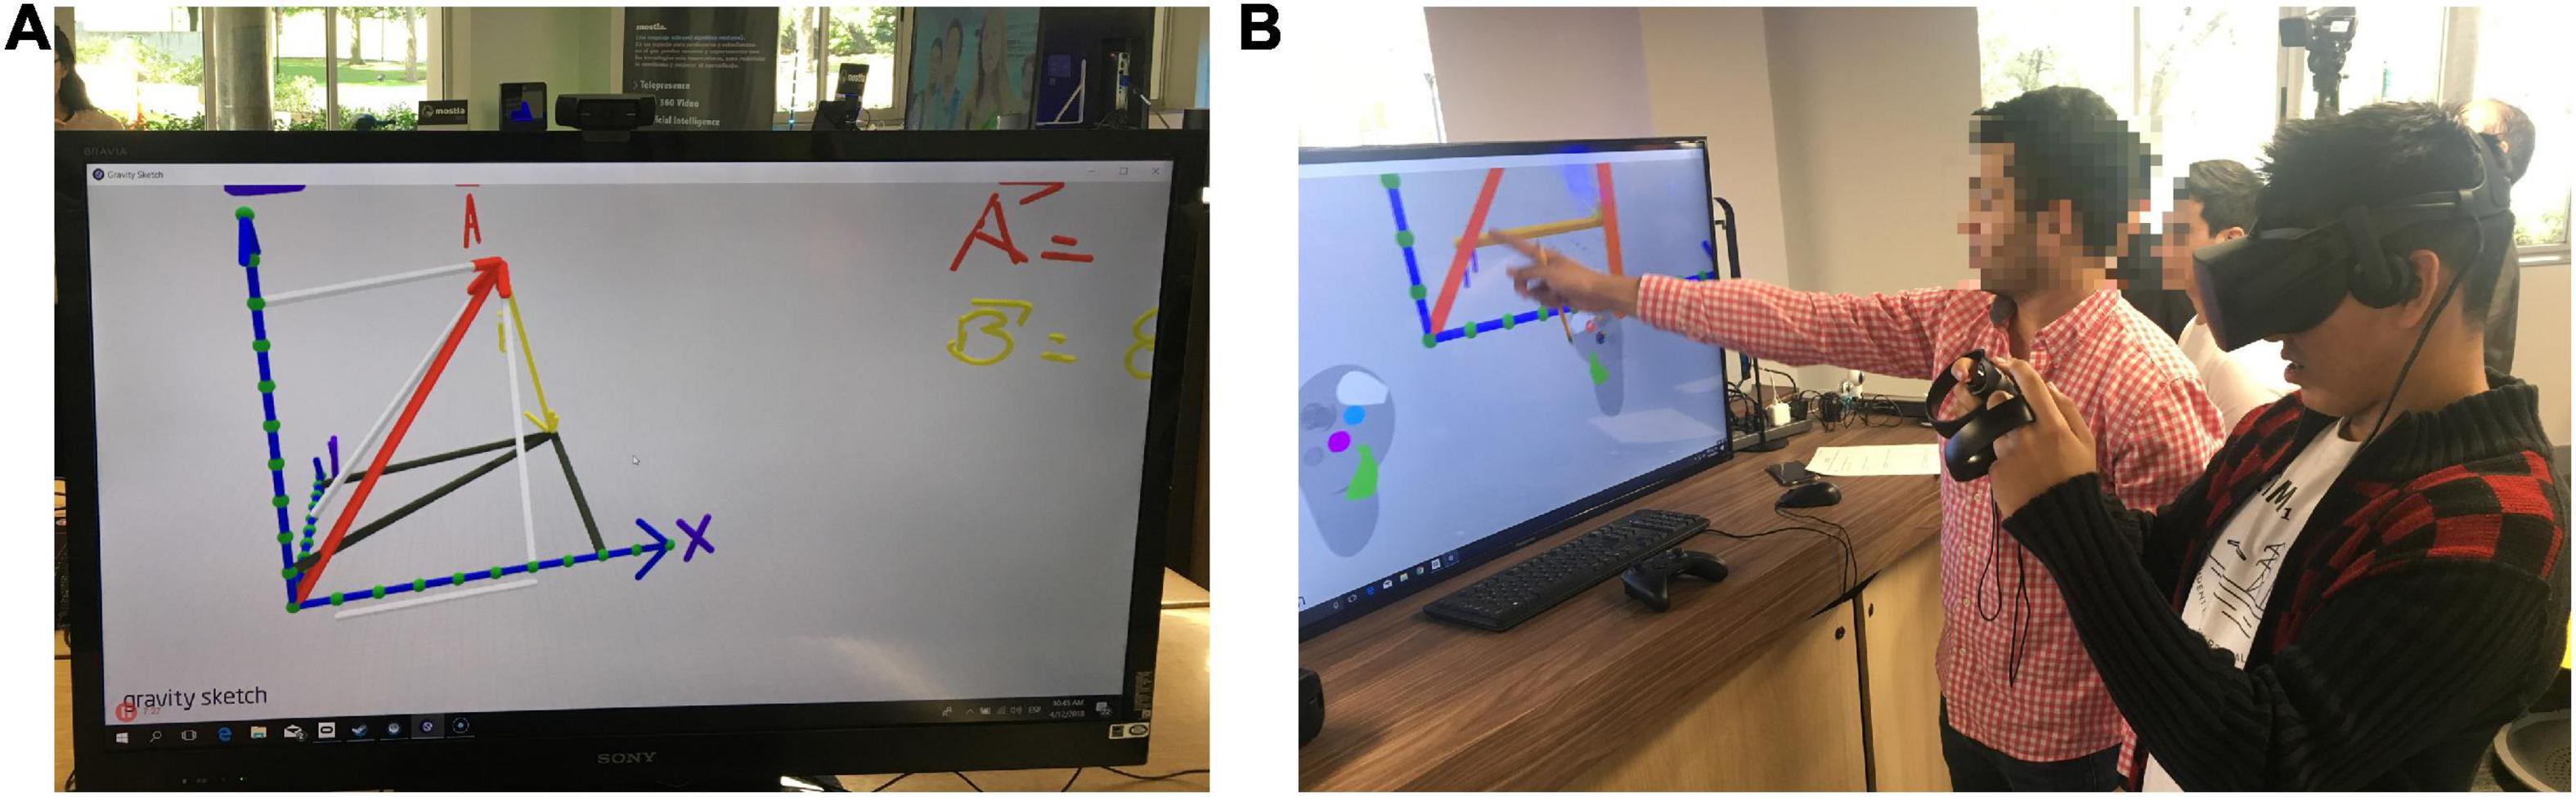
Figure 1. Details of implementation with Gravity Sketch. (A) Example of vectors in Gravity Sketch. (B) Students interacting through the virtual reality (VR) goggles and with the screen.
The students worked in teams of four students, assigned randomly, with preassigned activities that promoted observation of three-dimensional vectors using VR equipment. For teamwork, an external monitor is connected, which allows students outside the virtual world to watch what the student who uses the VR is watching. The students had one group session with the instructor to carry out the first activity. In this session, they learned to use the VR equipment with immediate feedback from the instructor. After the first session, the teams attended the VR lab outside of class time to complete all the activities.
For example, we provide the design of one activity, where students learn to identify the angles alpha, beta, and theta. The activity instructs students to create a Gravity Sketch file based on the Cartesian axes file (a previously designed file), and to draw a vector that begins at the origin and ends at some point of the first octant naming this vector as A. The activity asks students to draw the alpha, beta and theta angles for vector A on the virtual reality simulation. Additionally, in their worksheet, students receive the following instructions:
a. Define the vector A in terms of the unit vectors i, j, and k.
b. Calculate the magnitude of vector A.
c. Calculate the angle α.
d. Calculate the angle β.
e. Calculate the angle θ.
f. With the three angles that you calculated, compute: cos2α + cos2β + cos2θ.
This activity has easy-to-follow and clear steps to visualize the angles in the three-dimensional virtual setting and to construct the algebraic representation of the three angles based on observations. Since this is a collaborative task, the team members can see the projection of the VR setting on the screen and write their calculations and conclusions on the worksheet. In Gravity Sketch, students were able to visualize the vectors in 3D, changing the perspective when they walked or moved their heads. They could also draw their own vectors, project them on planes and measure the dimensions of each vector, allowing them to calculate magnitudes and angles. The activity itself may take little time for experienced learners, but for most students, this course is their first approach to using VR, and they take turns using the VR equipment. The three activities follow a similar design with different objectives. The first activity helps students familiarize themselves with the equipment and define different vectors in the i, j, k unit vectors. The second activity is the example that we presented. The third activity prompts students to visualize the projection of the angles in the x-y plane and calculate the angle phi.
Research questions
Our main research question is: How does using VR impact students’ learning and students’ perceptions of learning three-dimensional vectors in an introductory physics course? We direct our research question to two constructs, student learning of three-dimensional vectors and students’ perception of their experience using virtual reality. We identify three subordinate research questions:
• How does using VR impact students’ learning of three-dimensional vectors in an introductory physics course?
• How do students perceive their learning outcomes achievement when learning three-dimensional vectors using VR in an introductory physics course?
• How do students perceive their experience using VR for learning three-dimensional vectors in an introductory physics course?
Materials and methods
We present the methodology with an experimental design. We had one control group and one experimental group, and we measured their performance in a pre-post questionnaire. We additionally surveyed the experimental group about their perception of the use of VR regarding their learning objectives, their experience in the VR sessions, using VR as a learning tool, and the value of using VR in class.
Participants
The participants were 94 first-year engineering students (18–20 y/o) taking the introductory physics course in a large private Mexican university. The course is a full-credit undergraduate course at the university, consisting of 3 h of class time each week for 16 weeks (48 h in total). In this course, students develop the ability to learn and apply mathematical concepts and tools to model problems in physics that are useful to them in their professional lives. The course is highly focused on the use of vector quantities for the study of engineering. The teaching approach is active learning; students work collaboratively, guided by activities designed to generate team discussions. The textbook is Introduction to university physics, which consists of three volumes: activities, problem manual, and concepts and tools (Alarcón and Zavala, 2012).
The control group (NC = 29) took the regular introductory course at the university, benefiting from all the elements described above. The experimental group (NS = 65) took the same course with the VR sessions instead of the guided activities related to three-dimensional vectors. The same instructor taught both courses, and the control and experimental group were assigned randomly. Students acknowledged their willingness to use the VR tools and participate in the study voluntarily and provided consent, knowing their information would be used anonymously.
Instruments
We have two instruments for this study, a pre-post 3D vector questionnaire for the control and experimental groups and a survey about students’ experience with VR, which was only applied to the experimental group. The pre-post questionnaire consisted of 14 multiple-choice questions about vector magnitude, direction, and projection. Six of the fourteen questions required students to analyze the range of possible values for the angles between a vector and the axes, alpha, beta, theta, and phi. We present these six questions in Table 1. The remaining eight questions were dedicated to computing the magnitude or projection of a specific vector. We present these eight questions in Appendix Table A1 for reference. In general, the questionnaire evaluates students’ abilities to visualize, identify, and understand the definitions of the alpha, beta, theta, and phi angles with respect to the coordinate axes.
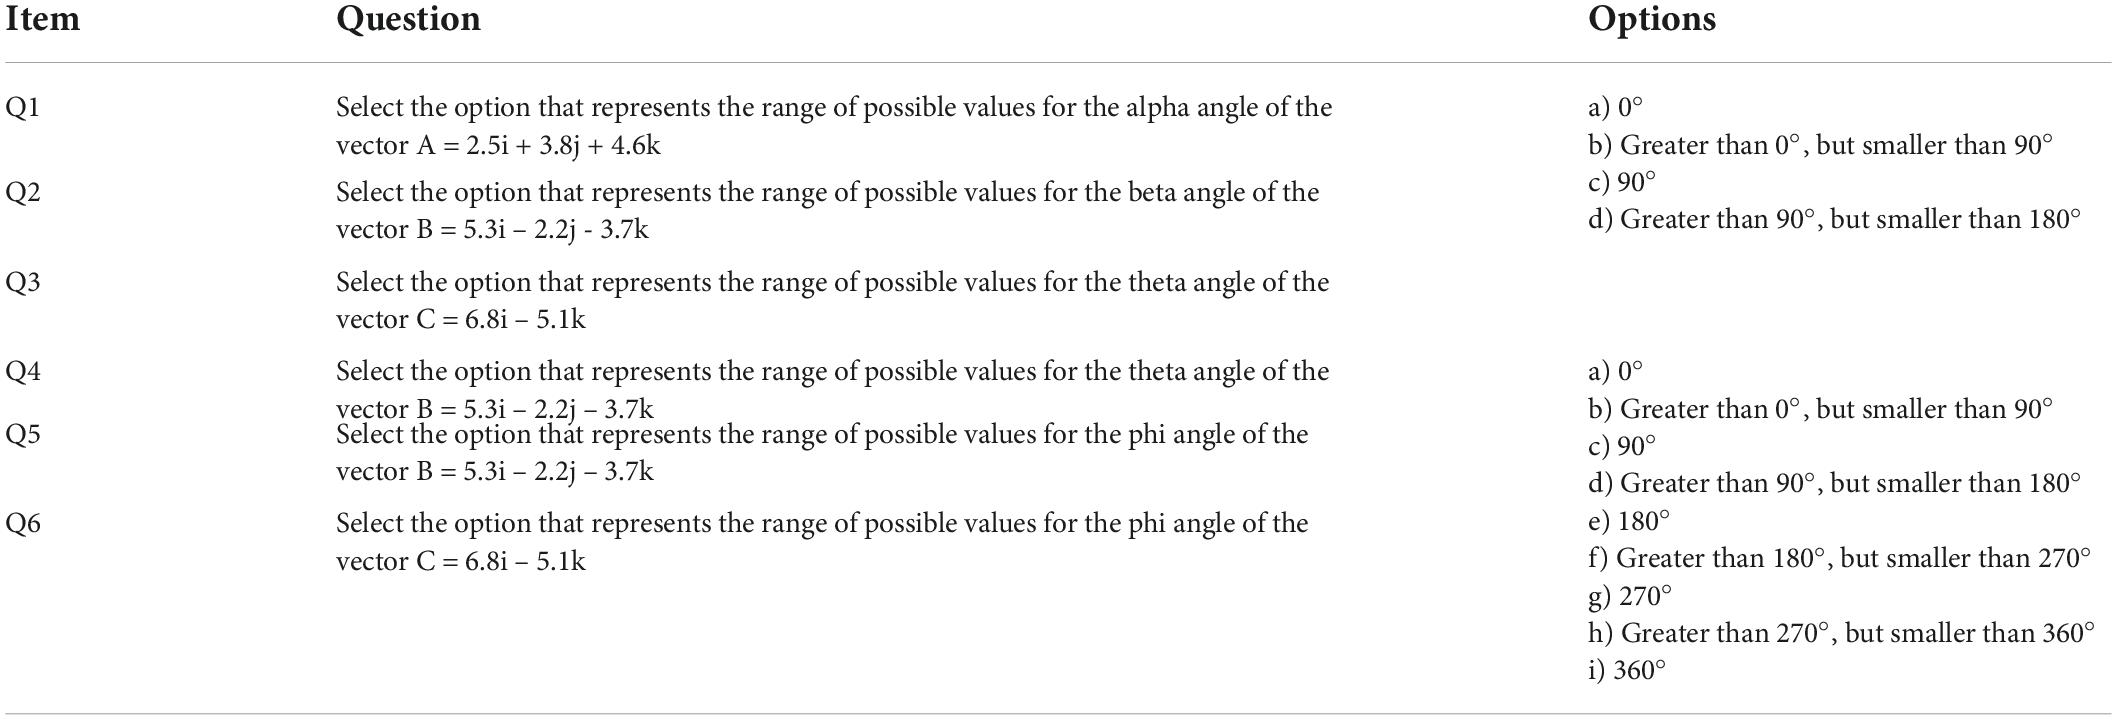
Table 1. Six items of the pre-post questionnaire with the objective of analyzing the angles alpha, beta, theta and phi of different vectors.
The survey of experience consisted of 8 qualitative questions, six open-ended and 2 yes/no questions (see Table 2), and 15 quantitative Likert-scale questions with five levels of agreement, ranging from strongly disagree (1) to strongly agree (5) (see Table 3). The open-ended questions provide information about students’ perception of their achievement of learning objectives and their own experience with the VR setting. The Likert-scale questions provide information about using virtual reality as a learning tool and the value students find in virtual reality.
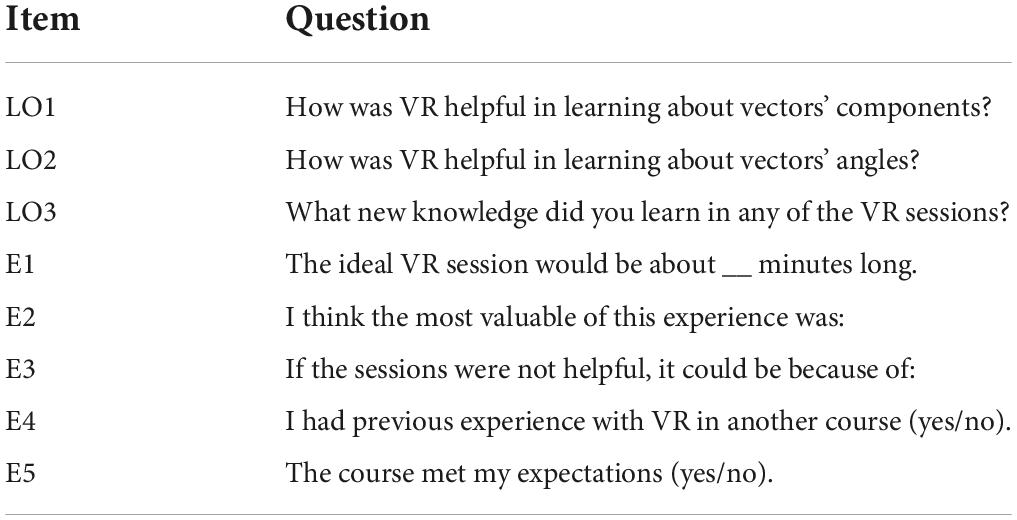
Table 2. Open-ended questionnaire about students’ learning objectives and experience using virtual reality (VR).
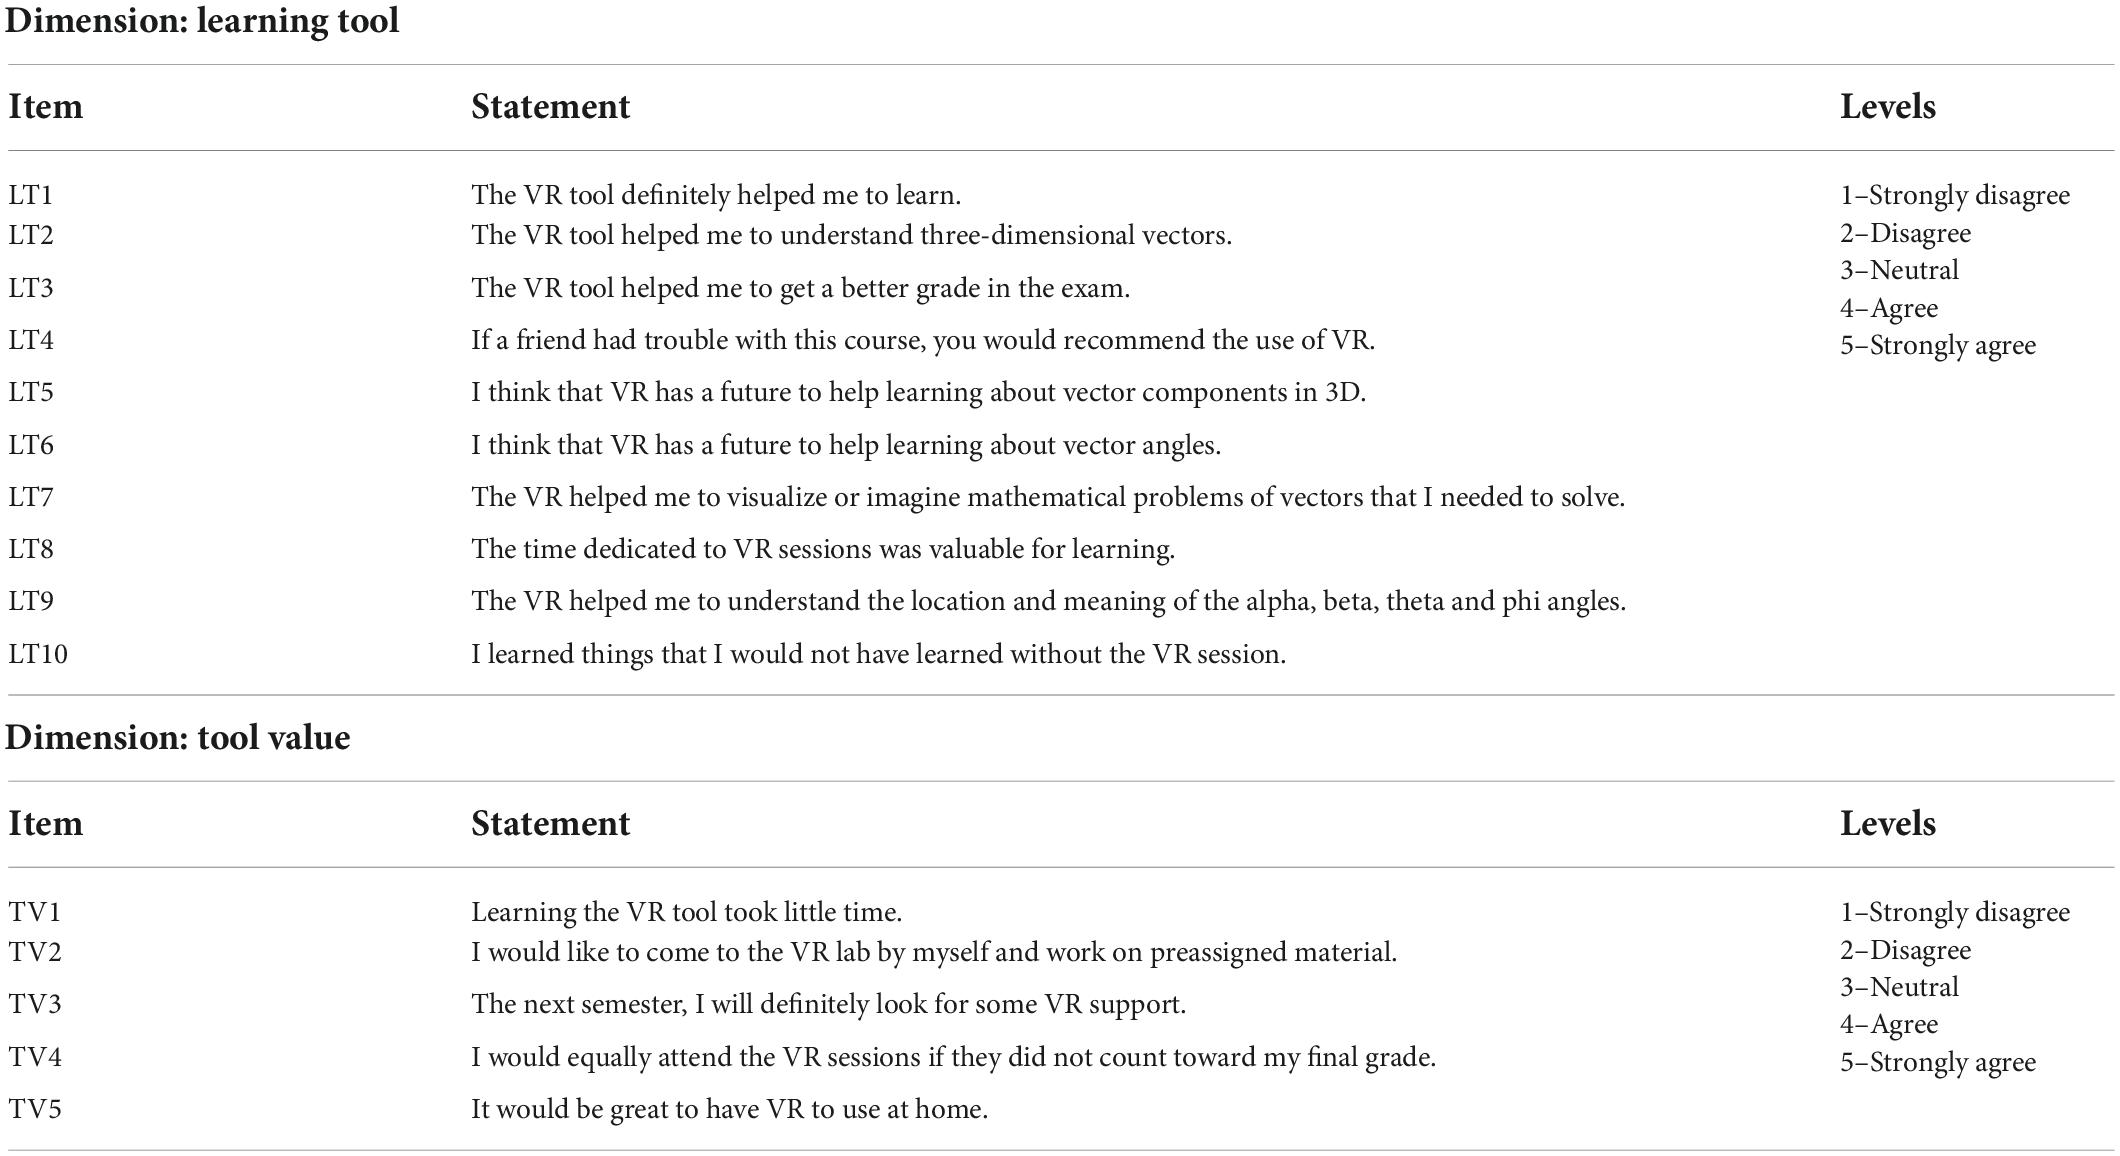
Table 3. Likert-scale questions related to students’ learning objectives and experience using virtual reality (VR).
Data collection and analysis
The experimental design consisted of the pre-post questionnaire (Table 1), the implementation of the VR sessions in the experimental group, and the experience survey (Tables 2, 3) to the experimental group. All the control and experimental group participants answered the pre-questionnaire before covering the topic of vectors in class. The topic of vectors was covered in 2 weeks. During these 2 weeks, the control group had regular active learning instruction. The experimental group had the first VR session with the instructor and worked on the VR activities outside of class time. After covering the topic of vectors, the students from the control group (NC = 29) and the experimental group (NE = 55) answered the post questionnaire. The experience survey with open-ended questions and Likert-scale items was implemented 2 weeks after the VR sessions for the experimental group only (NS = 65). The control group did not answer the experience survey because they did not attend the VR sessions. The instruments were implemented through Google Forms.
The pre-post questionnaire was scored as correct/incorrect for all the questions since they were multiple-choice questions. All the questions had the same weight, and the score was calculated with the average of correct answers. We analyzed the pre-post questionnaire using the normalized learning gain (Hake, 1998). This measure analyses the differences between the pre and post-average scores and normalizes them by comparing them to the highest possible score. If the highest score is 100, then the normalized gain is calculated with: g = (%sf - %si)/(100 - %si), where g is the gain, %sf is the percentage of the final score, and %si is the percentage of the initial score. The learning gain provides evidence about the effectiveness of an educational intervention.
We analyzed quantitative data from the Likert scale questionnaire using SPSS. We performed a principal component factor analysis with an Oblimin rotation since it does not have to force the factors to be orthogonal. As with any other social scale, the factors could be correlated. The analysis divided the 15 items into two components that we called dimensions. The first dimension we call “learning tool” has 10 items related to statements describing how VR helps students learn. The second dimension, we call the “tool value,” has five items related to how students value VR. Cronbach’s alphas for the survey were 0.93, and the learning tool, dimension and tool value dimension were 0.94 and 0.84, respectively. We analyzed the qualitative data from the open-ended questions through coding, reaching moderate interrater reliability (Cohen’s kappa = 0.71) (Donkin and Kynn, 2021).
Results
Impact of virtual reality use on learning
We present the results for the first subordinate research question, how does using VR impact students’ learning of three-dimensional vectors in an introductory physics course? The pre-post questionnaire was a 14-item questionnaire that included the six questions presented in Table 1, and eight more questions that asked students to calculate the magnitude or projection of a specific vector (Appendix Table A1). We analyzed the normalized learning gain for the complete questionnaire (14 items) and found no significant difference between the control and experimental groups (0.38 and 0.36, respectively). Both groups had a learning gain greater than 0.3, which is medium, according to Hake (1998). This implies that the control and experimental groups have similar learning. Both groups benefit from the active learning strategies implemented by the professor and the course content, regardless of the VR use.
We selected the six questions in Table 1 because these items specifically address the ability to visualize the relations between the vectors, their components in the three-dimensional axes and the angles between them. We aim to see whether the VR implementation helped students to improve their visualization of the relationship between vectors, components, and angles. We calculated the normalized learning gain for these six questions independently. We found that the control group had 0.14, which is a low gain in Hake’s (1998) definition, while the experimental group had 0.27, which is a medium gain. As described by Hake (1998), the difference in the learning gains provides evidence that the VR implementation helped students improve their visualization ability of vectors in three-dimensional space.
Student’s perception of learning outcomes achievement
We present the results for the second subordinate research question; how do students perceive their learning outcomes achievement when learning three-dimensional vectors using VR in an introductory physics course? We provide two perspectives for answering this question. We first provide the Likert scale survey results, where students evaluated the use of VR as a learning tool and its perceived tool value. We then present the results of the qualitative analysis of learning objectives.
Likert-scale survey
We present the results of the Likert scale items for the two dimensions: “Learning tool” and “Tool value,” in Figures 2, 3, respectively. Both figures use traffic light colors to represent the level of agreement or disagreement: The green side represents an agreement, the yellow percentage represents neutrality, and the orange and red sides represent disagreement.
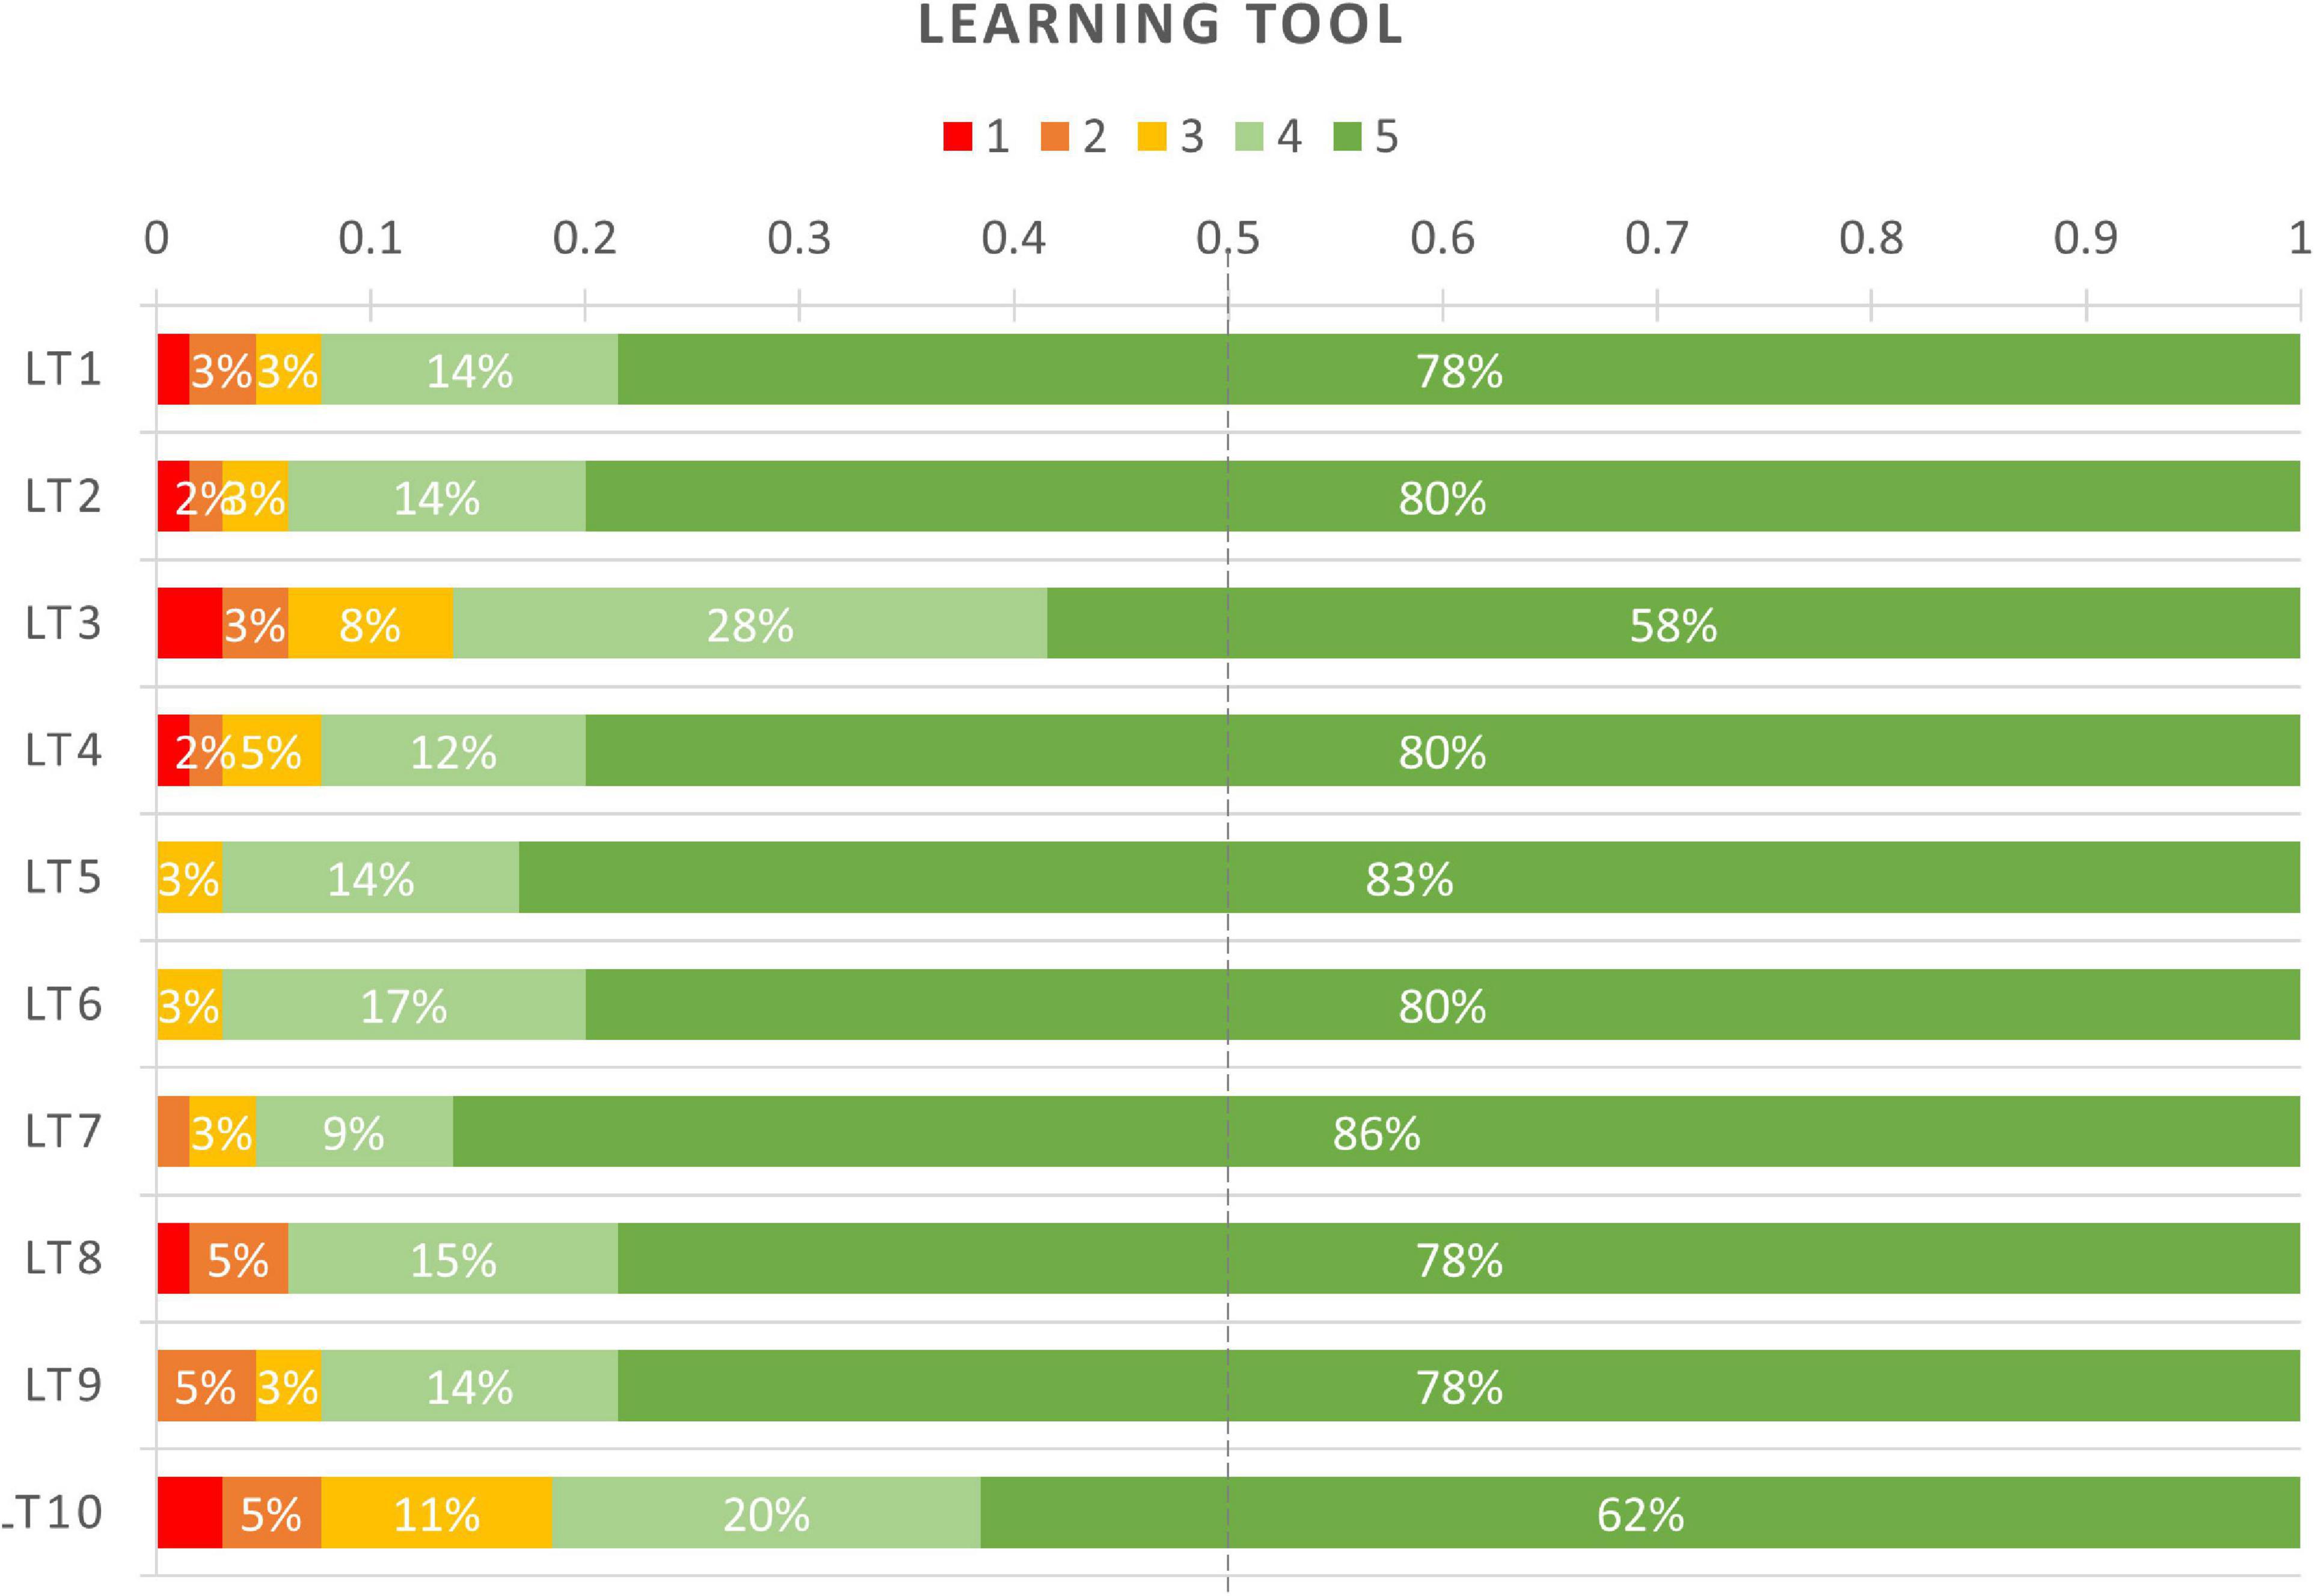
Figure 2. Results of Likert-scale dimension of the use of virtual reality (VR) as a learning tool.
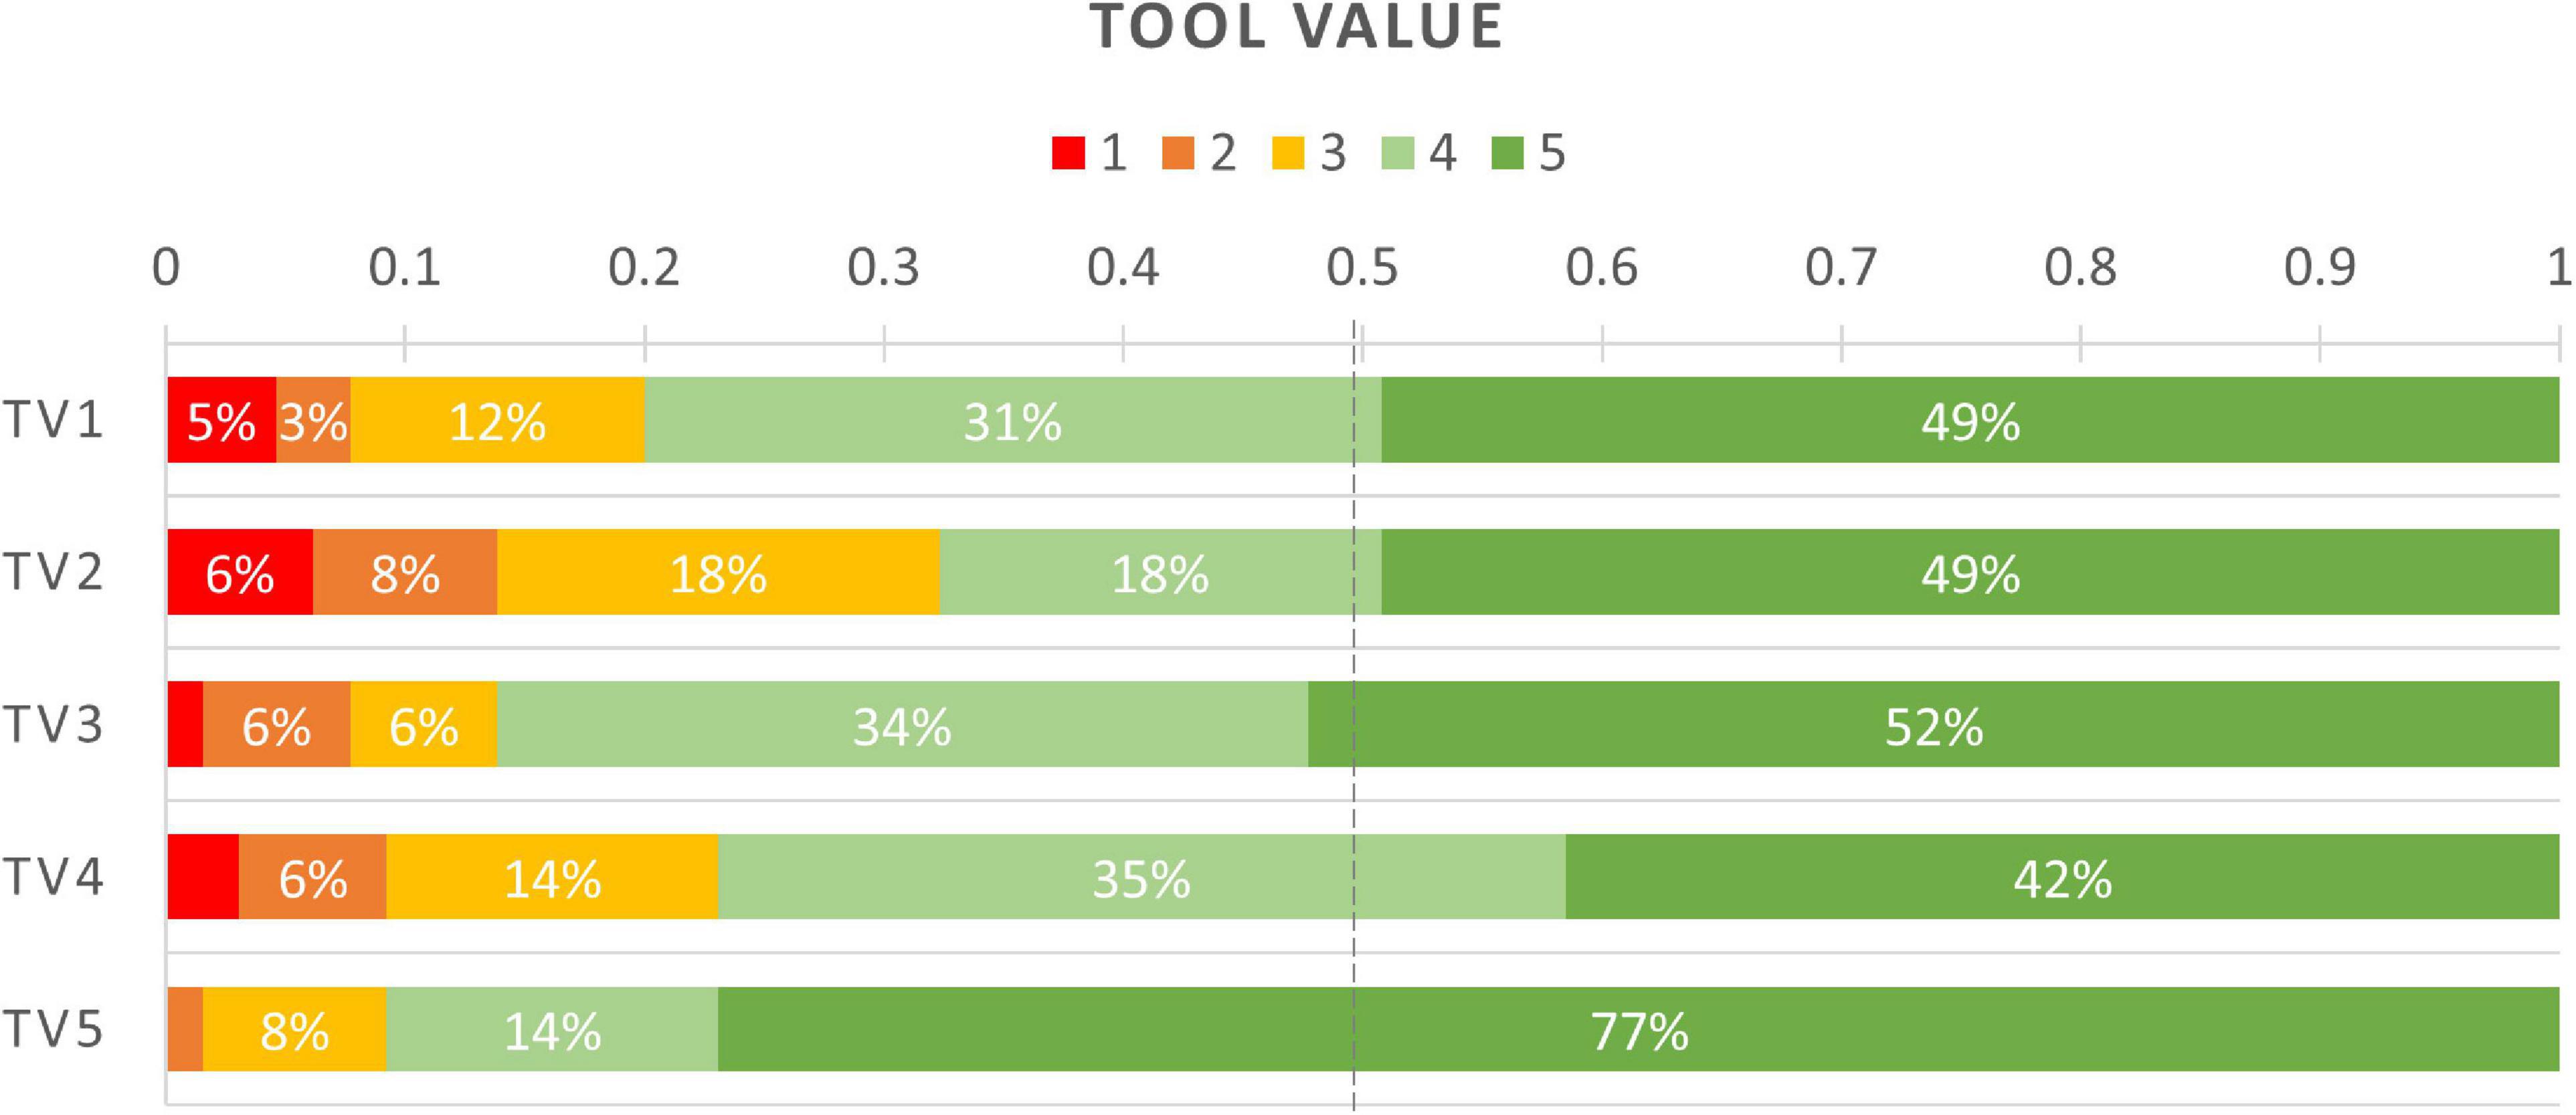
Figure 3. Results of Likert-scale dimension of the value of virtual reality (VR) as a tool.
In the dimension “Learning tool,” students evaluated whether they agreed or disagreed with 10 statements about using VR as a learning tool. We found that over 90% of students agree that VR helped them learn, understand three-dimensional vectors, visualize mathematical problems involving vectors, and understand the location and meaning of the angles between vectors and three-dimensional axes. They also agree that the time dedicated to VR sessions was valuable for learning, and they see the future of VR as helping to learn about angles and vector components. They agree that they would recommend a friend use the VR tool for learning if they had trouble with the introductory course. The only items where students had a minor agreement (at least 80%) were about getting a better grade in the exam and learning something that they would not have learned without the VR tool.
In the dimension “Tool value,” students evaluated their agreement with five statements about the worthiness of using VR for learning. More than 90% of students agree that it would be great to have VR at home. Over 80% of students agreed that they would look for courses with VR support in the future and that learning to use the VR tool took little time. More than 75% of students agreed that they would attend the VR sessions even if they did not count toward their grades. Over 65% of students agreed that they would like to attend the VR lab by themselves to work on preassigned materials.
Qualitative analysis of learning objectives
Three open-ended questions assessed students’ achievement of learning objectives. Items LO1 and LO2 referred to how the VR was helpful for students to learn about vector components and angles, respectively. Item LO3 referred to new knowledge learned while doing the VR sessions.
Since items LO1 and LO2 were similar in nature, the same four categories emerged when analyzing students’ answers to these two questions: Visualization, 3D visualization, Identification, and Understanding. We describe these categories in Table 4 and propose a pyramidal structure, as shown in Figure 4. In the hierarchical structure, we find that at the most basic level, the VR tool helps students to visualize the components and the angles of the vectors. The next level explains that the VR tool helps students to visualize in three dimensions. Some students that explain that VR helps them visualize may refer to the three-dimensional aspect of it, but they were not explicit. The third level would be an identification of the components and angles. This is higher than visualization because it not only helps students visualize but they are also able to identify and possibly relate the vectors with mathematical systems. At the highest level, we find that the VR tool helps students to understand the vectors’ components and angles in a way that would have been more difficult otherwise. When students’ answers reported two or more levels, we classified them as the highest.
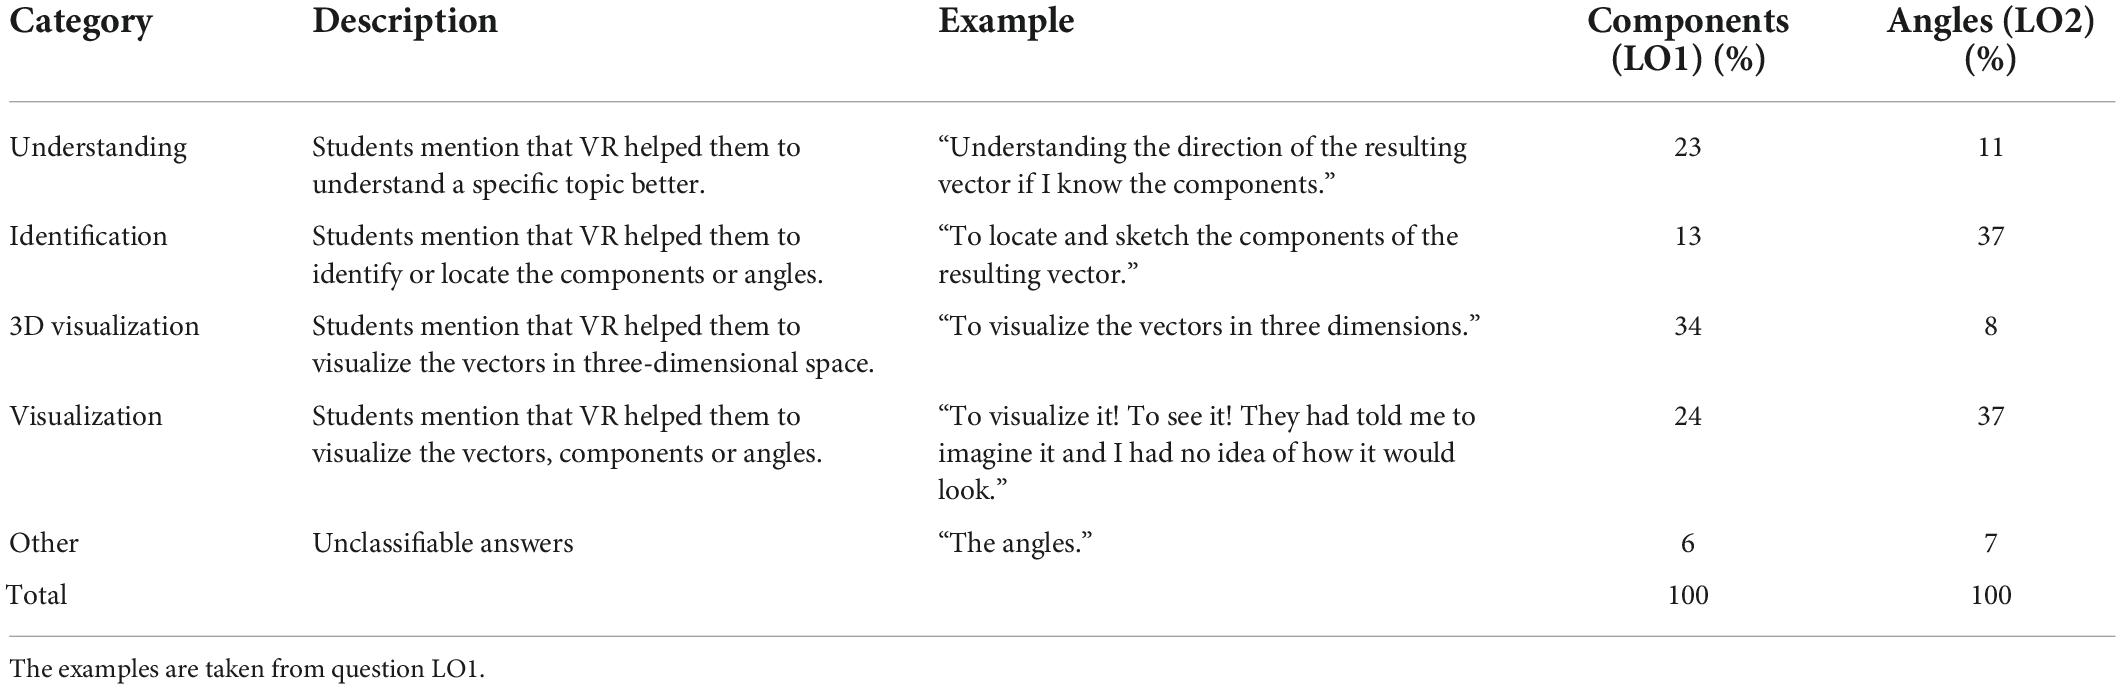
Table 4. Description of categories for questions LO1 and LO2.
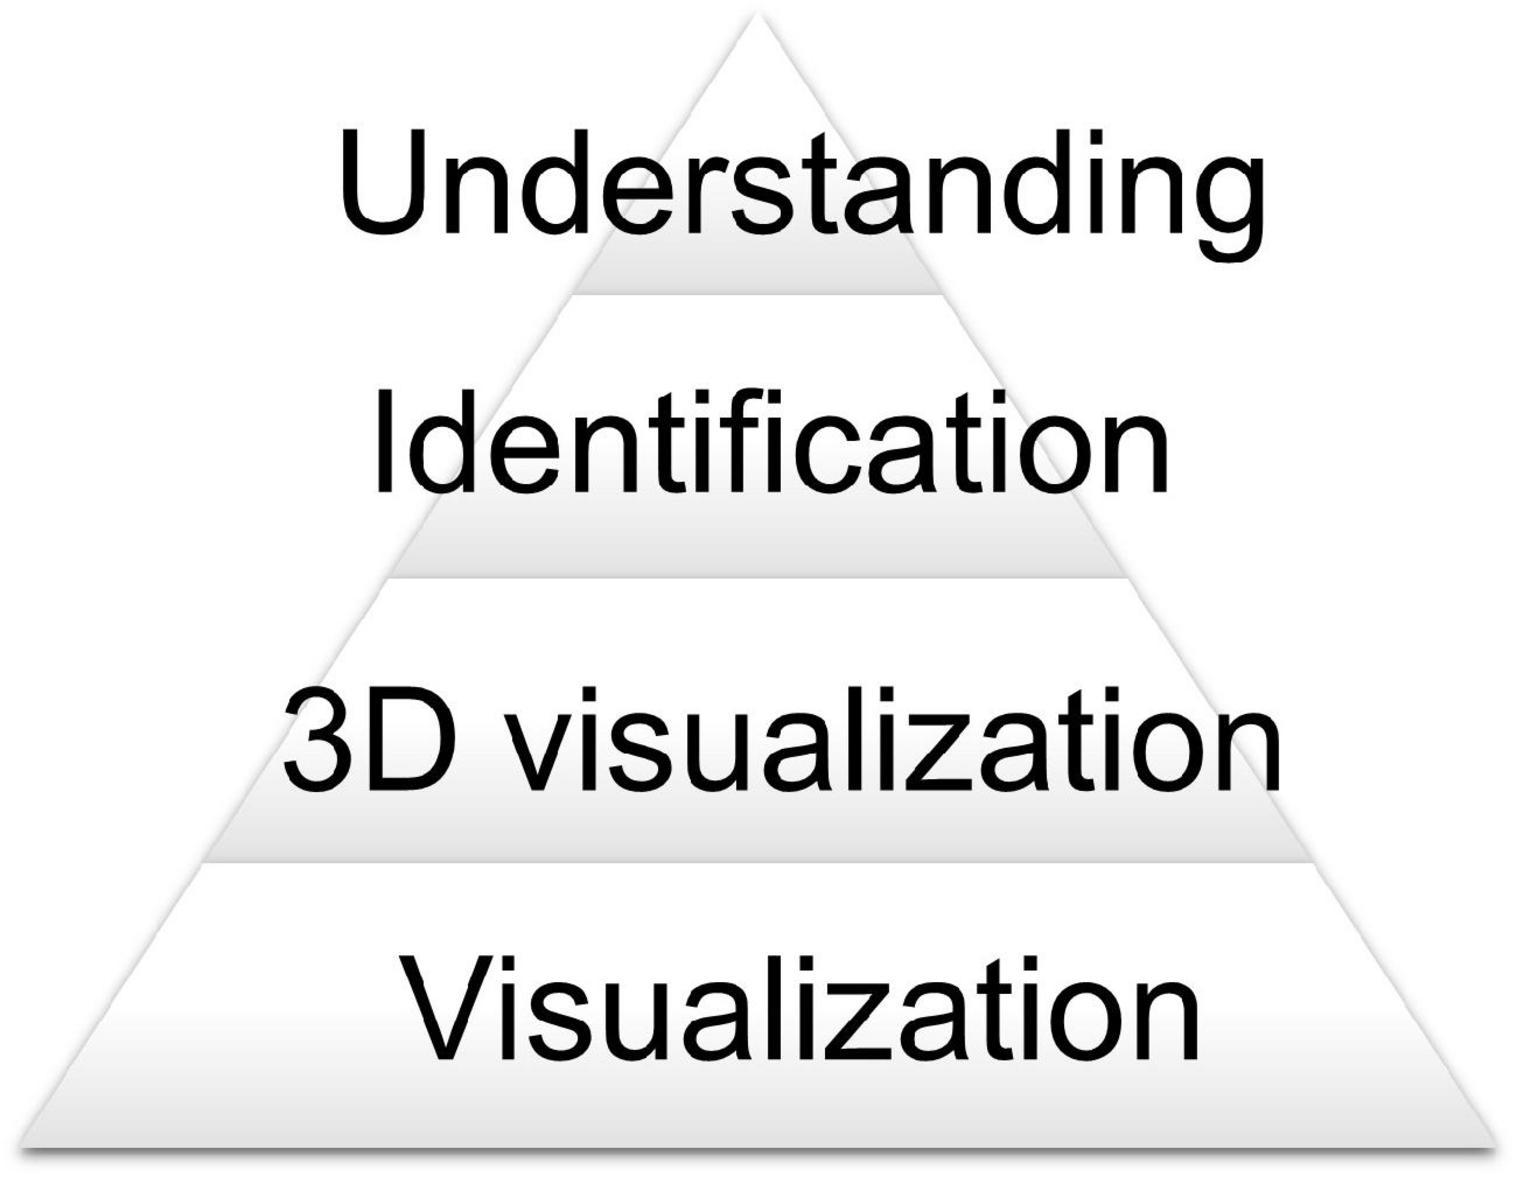
Figure 4. The categories that emerged in questions LO1 and LO2 have a hierarchical structure, with visualization as the most basic learning objective and understanding as the highest.
In item LO3, students reflected on their learning achievements and answered what new learning they had during the VR sessions. Due to the openness of the possible answers, we analyzed the emerging categories differently because they do not have a hierarchical structure. We present the results in Table 5. In a few cases, students’ answers could fit in more than one category, so we considered them in all the categories they could fit. We found that the most frequent category was that students learned about 3D vectors in general. This broad category was sometimes present with the categories Angles, Projections, and Components, which are all related to specific learning topics about 3D vectors. In Figure 5, we present how the categories Angles, Components, and 3D Vectors interacted; these categories were the three most frequent that pertain to the disciplinary learning of vectors. The next big category was Virtual Reality. Students categorized their learning consistently. We observe that the largest proportion of students mentioned 3D vectors which is what the tool is for. The second largest proportion is the angle in which it is the content students struggle with most in this course. The gain results of the pre and post-questionnaire are evidence that they learned better angles using VR.
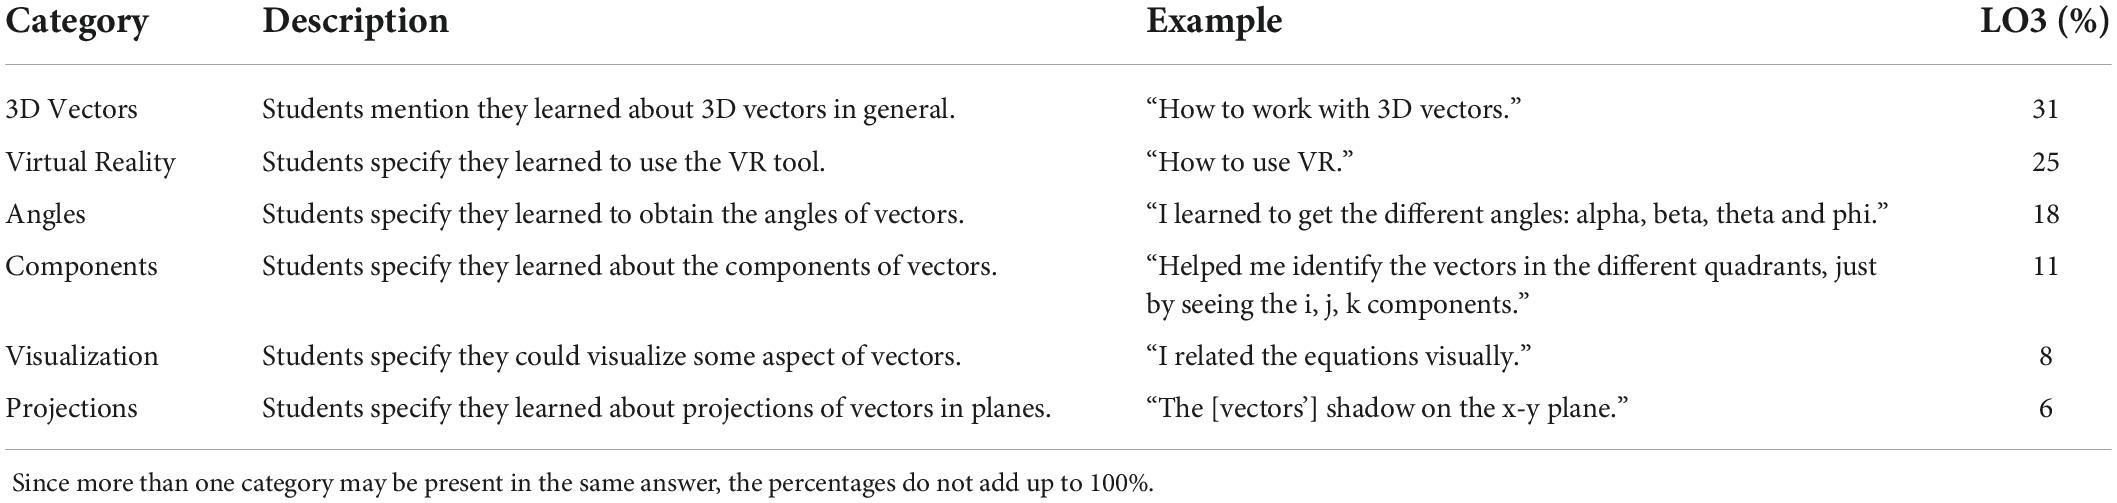
Table 5. Description of categories for question LO3.
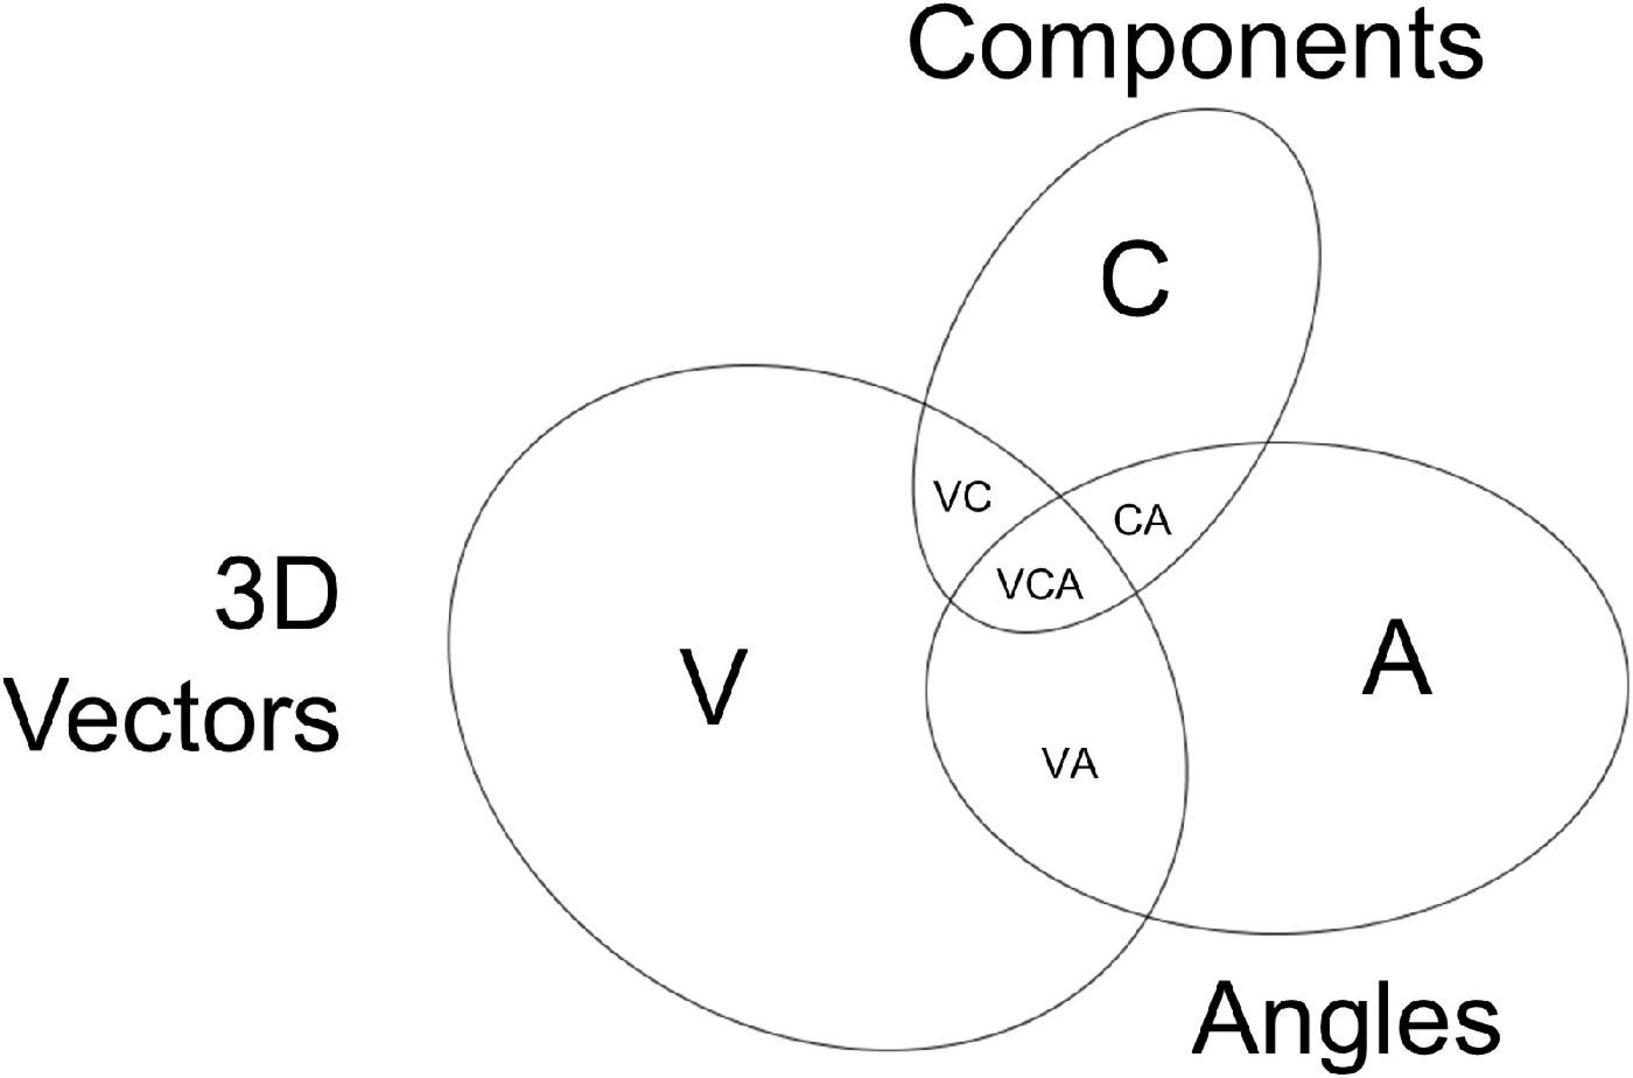
Figure 5. We represent the interaction between the 3D Vectors, Components, and Angles categories. We present a weighted Venn diagram generated using EulerAPE (Micallef and Rodgers, 2014).
Qualitative analysis of students’ experience
We present the results of the third subordinate research question: How do students perceive their VR experience in learning three-dimensional vectors in an introductory physics course? This section analyzes some aspects of students’ experience using VR. We found that 85% of our students had not had previous experience with VR in other courses, so this was their first VR experience. It is important to describe students’ experiences from two perspectives, their most valuable takeaways and the factors that could have affected their experience negatively.
In Table 6, we present their most valuable takeaways, which are identified in four categories: educational experience, learning, virtual reality, and visualization. In the previous section, we see that these categories are congruent with students’ answers about their learning objectives. For example, we get here two categories that are related to learning outcomes: learning as a broad category that includes several aspects, and visualization, which we identified as the first level of the learning hierarchy in Figure 4. Furthermore, we see that 25% of students answered that they learned using the VR in Table 5, and 25% of students described that using VR was their most valuable takeaway from the experience in Table 6, so we see that for one quarter of our students the VR was a lesson in itself. These findings are supported by item E5, in which we found that using VR tools helped meet the expectations of 91% of students who answered “yes.”
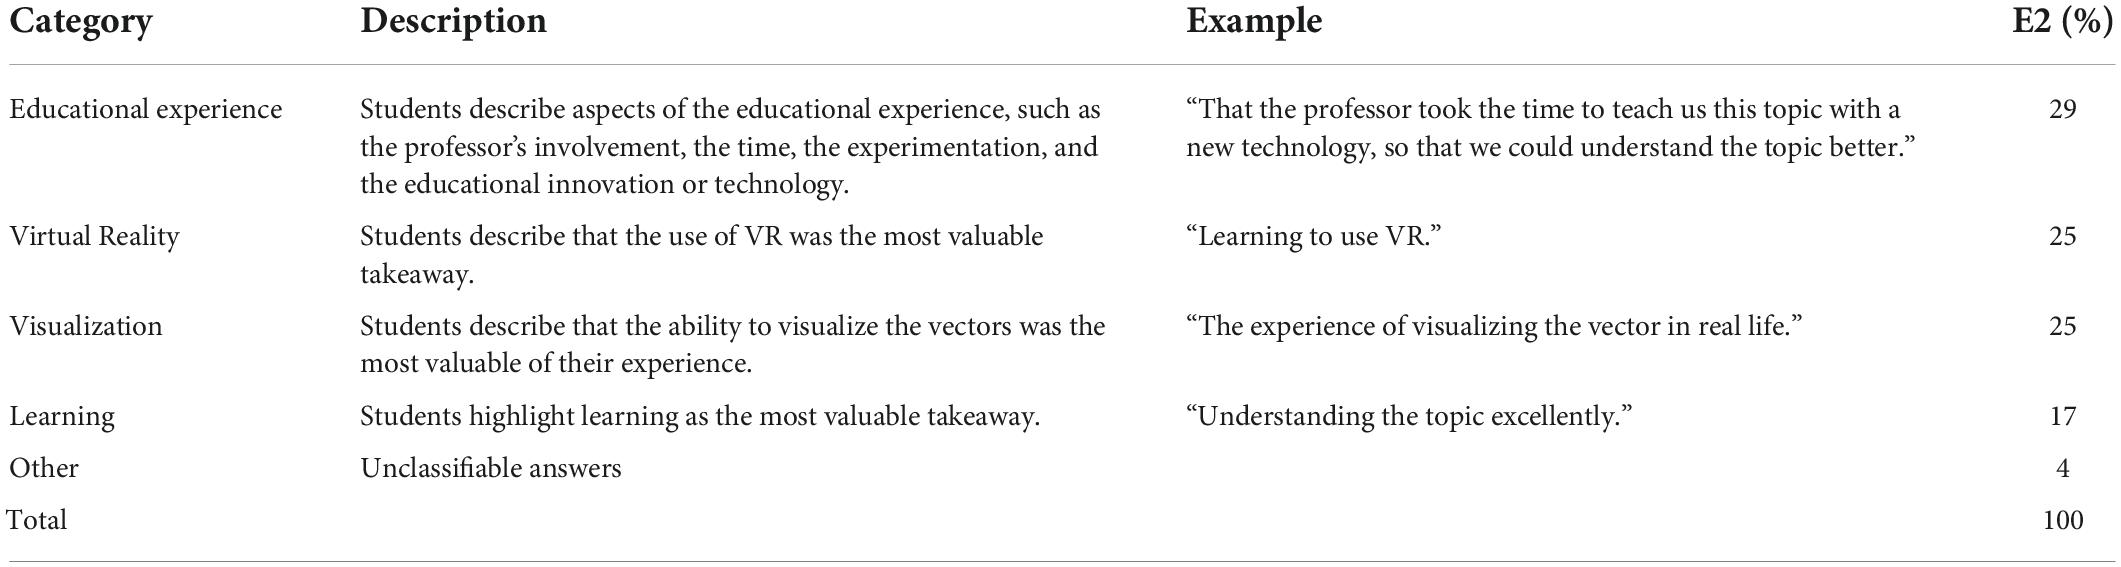
Table 6. Description of categories for question E2: “I think the most valuable of this experience was.”
Table 7 presents the aspects that could affect students’ VR experience. The categories that emerged when analyzing item E3 were motivational aspects, such as attention and interest, and limitations such as their poor familiarity with the VR tool, the content knowledge, and time. We think it is important to acknowledge that students have their own limitations and that implementing a new and exciting technology in class will not mitigate these limitations completely. Students recognized two motivational aspects that could affect their VR experience: attention and interest. Together, they represent 37% of the students. Also, when introducing new technologies in the classroom, there will be limitations of familiarity with the technology and the time of instruction. Analyzing item E1, we found that 75% of students prefer VR sessions of 30–60 min; More precisely, 38% think the sessions should be anywhere between 30 and 59 min, and 37% think they should be 60 min long.
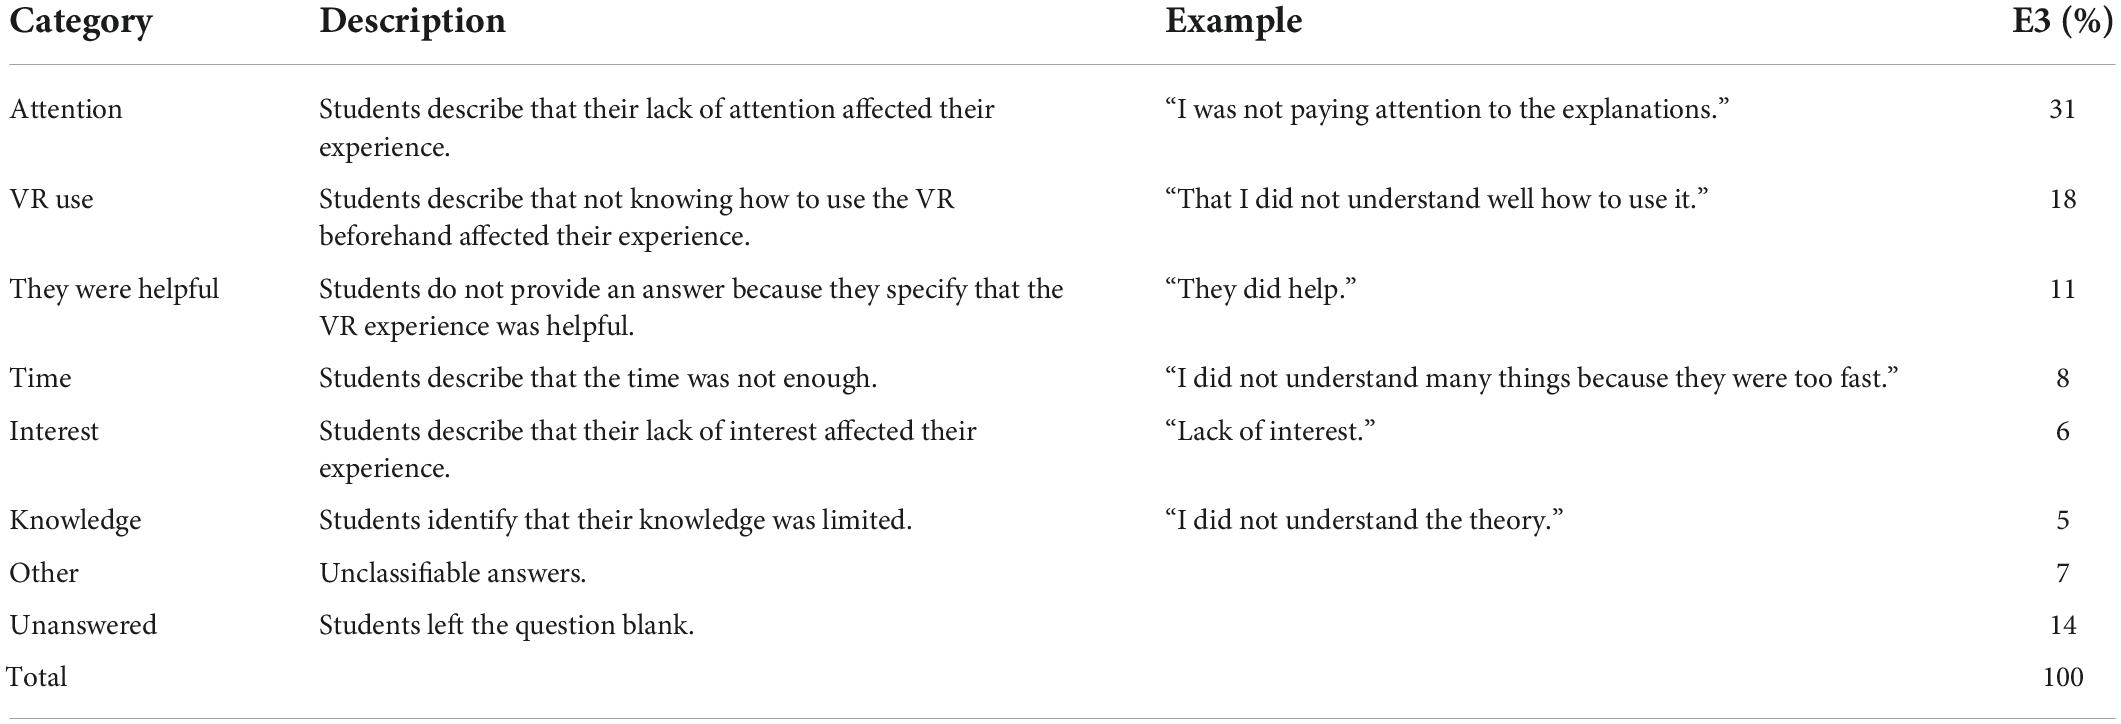
Table 7. Description of categories for question E3: “If the sessions were not helpful, it could be because of.”
Discussion
Our findings suggest that using VR in a vector course positively impacts learning three-dimension vectors and positively impacts students’ perceptions of the experience of using that tool. Emerging technologies in education are becoming more common in recent years (Chou et al., 2001; Broisin et al., 2017; Paxinou et al., 2020). One of the main objectives in any use of technology, however, not the only one, is the impact technology has on learning. However, learning can be improved with the use of the tool and by motivating students to learn with a positive experience using the technology.
The 14-item pre and post-questionnaire results and the six items in which the visualization takes an important role are evidence that this technology has potential for the learning of vectors. We realize that the use of VR for visualization helps students in general with the course contents, i.e., the overall gain was the same for the control and experimental groups; however, on those items in which the visualization is necessary, students in the experimental group had a better result. Taking as reference the description of the ranges in values for the learning gain in some other topics in physics (Hake, 1998), the results for learning gain for all students in this course is in the middle range. According to the characterization of Hake (1998), this result indicates that this course uses active learning activities. However, the results are different in those items in which visualization was essential. Students in the control group obtained a learning gain in the range considered low, and for students in the experimental group, their gain was still in the middle range. This evidence that the VR technology used in vectors helps students better understand some content in which visualization is an essential tool and has no effect on other types of content.
The results of the experience survey (subsection Student’s Perception of Learning Outcomes Achievement) present positive student perceptions of the use of this technology. The 15-Likert type items (see Table 3) are part of the evidence of how students perceive the technology as a learning tool and the value of the tool. In the learning tool dimension of the survey, the students’ agreement is between 82 and 97%. Students perceive that VR helped them better understand the vector concepts in the class, such as the three-dimensional vectors, visualization of the angles, and components of vectors. If we look at the pre and post-test questionnaire results, we have evidence that this is not only their perception; students did better on those concepts.
There are also positive students’ perceptions of the value tool dimension. However, in this dimension, the results are not as good as in the learning tool dimension. We interpret the best results of this dimension to be in items in terms of access. Students agreed with “It would be great to have VR to use at home” since, in that way, they could have used the tool in a more flexible way (access to the tool). Moreover, students agreed with “The next semester, I will definitely look for some VR support” which is another way of access for future use that could have come in handy in other courses.
On the other hand, the lowest proportion of agreement came in items for which students were asked for extra work. The items “I would like to come to the VR lab by myself and work on preassigned material” and “I would equally attend the VR sessions if they did not count toward my final grade” have this characteristic. They are items in which students have to do extra work, either going to the lab or doing the activities without credit. However, students still have positive perceptions, with the agreement of 67 and 77%, respectively.
Table 4 and Figure 4 show a connection between students’ perceptions and what they learn. Table 4 shows that the percentages for each category (each level) are similar for components and angles. The difference is in the 3D visualization and identification. However, the results agree with the content. In LO2 (angles), students think more about identifying them, which is one of the most challenging tasks in this topic. On the other hand, in LO1 (components), students think more of the 3D visualization, which is essential for vectors in three dimensions. In particular identification, the highest-level category besides understanding has 37% for angles, which is essential to answer some pre- and post-questionnaire questions.
We also found that some students value the technology by itself. Table 5 shows that 25% of students answered that what they learned was the use of VR, opposite to the rest, in which they mentioned content (3D vector, angles, components, projections) or tools for learning like visualization. The same happens in Table 6, in which 25% of students described that using VR was their most valuable takeaway. In any use of new technology, some students will pay more attention to the technology instead of what the technology is used for.
A small proportion of students blame VR whether they have problems learning. In Table 7, we present evidence of that tiny proportion. It is helpful to identify blank answers because of how the question was framed. We asked students to provide a reason if the sessions were not helpful, so the students who left the question blank probably did not think of why the session would not be helpful. This, supported by the category “They were helpful,” adds to 25% of students. We think this is a promising finding because, regardless of students’ limitations, we can see that at least a quarter of students’ experiences was not affected negatively by internal or external factors.
Conclusion
In this study, we examined the impact of virtual reality on students’ learning and perception of the experience in a university introductory physics course in which vectors are part of the content. We used PC-powered VR equipment, each one with two controllers to interact with the virtual environment. We used Gravity Sketch, a software that allows students to manipulate vectors through a three-dimensional grid. It is possible to visualize, draw coordinate axes, identify components and angles, locate the vectors in the grid, and measure the vectors’ length. The students worked in teams with preassigned activities that guided their use of the VR equipment and promoted observation. We had one control group and one experimental group. We measured their performance in a pre-post questionnaire and a survey about their perception of VR’s use regarding their learning objectives and their experience in the VR sessions.
We found that on those items in which the visualization was important, students in the experimental group, i.e., using VR, did better than those who did not use VR. We have evidence that VR can help students visualize angles and components that help them solve problems better. It does not help students with all content, only on those problems in which the visualization has a central role. The use of VR technology positively impacts students’ perceptions of their experience. They value the VR assistance to help them better understand the vector concepts in the class, and some value the tool even if its use does not count toward credit. Students’ perceptions agree with their learning. Students perceive that VR helped them visualize angles and components essential for their performance in our content questionnaire. Some students will pay more attention to the technology instead of what the technology is used for. About one out of four students still found the use of VR as their most important learning. Finally, we found a small proportion of students who blame VR whether they have problems learning. Most of them blame personal reasons.
The limitations of this study might be that we developed our experiment in a Mexican university with specific university content. However, for instance, comparing our university educational system to that of the US, there are not many differences. Students study the same mathematics and physics before college and in their first year in a university engineering degree. We believe our results would be comparable to those in other universities worldwide whether VR is used in vector teaching.
This study’s findings contribute to the knowledge of using technology for education at the university level. This study helps instructors consider how they can incorporate VR in their classes, and we encourage university instructors to use VR in their classes. For future studies, we recommend using VR in other physics topics in which visualization is essential, such as electricity and magnetism, a discipline in which the object, the physical quantity (e.g., electric field) is abstract. The only way to access the object is through representations, something virtual reality can help.
Data availability statement
The raw data supporting the conclusions of this article will be made available by the authors, without undue reservation.
Ethics statement
Ethical review and approval was not required for the study on human participants in accordance with the local legislation and institutional requirements. The patients/participants provided their oral informed consent to participate in this study.
Author contributions
EC contributed to the study design, analysis of results, discussion, and wrote a first version of the manuscript. IH contributed to the study design, data collection, and analysis of results. GZ contributed to the study design, analysis of results, and discussion. All authors revised the manuscript before submission.
Acknowledgments
We would like to acknowledge the financial and technical support of Writing Lab, Institute for the Future of Education, Tecnologico de Monterrey, Mexico, in the production of this work.
Conflict of interest
The authors declare that the research was conducted in the absence of any commercial or financial relationships that could be construed as a potential conflict of interest.
Publisher’s note
All claims expressed in this article are solely those of the authors and do not necessarily represent those of their affiliated organizations, or those of the publisher, the editors and the reviewers. Any product that may be evaluated in this article, or claim that may be made by its manufacturer, is not guaranteed or endorsed by the publisher.
References
Al-Amri, A., Osman, M., and Musawi, A. A. (2020). The effectiveness of a 3D-virtual reality learning environment (3D-VRLE) on the omani eighth grade students’ achievement and motivation towards physics learning. Int. J. Emerg. Technol. Learn. 15, 4–16. doi: 10.3991/IJET.V15I05.11890
Alarcón, H., and Zavala, G. (2012). Introduction to university physics. Mexico: Trillas Publishing House.
Arici, F., Yildirim, P., Caliklar, Ş., and Yilmaz, R. M. (2019). Research trends in the use of augmented reality in science education: Content and bibliometric mapping analysis. Comput. Educ. 142, 103647. doi: 10.1016/j.compedu.2019.103647
August, S. E., Hammers, M. L., Murphy, D. B., Neyer, A., Gueye, P., and Thames, R. Q. (2016). Virtual engineering sciences learning lab: Giving STEM education a second life. IEEE Trans. Learn. Technol. 9, 18–30. doi: 10.1109/TLT.2015.2419253
Broisin, J., Venant, R., and Vidal, P. (2017). Lab4CE: A remote laboratory for computer education. Int. J. Artif. Intell. Educ. 27, 154–180. doi: 10.1007/s40593-015-0079-3
Buentello-Montoya, D. A., Lomelí-Plascencia, M. G., and Medina-Herrera, L. M. (2021). The role of reality enhancing technologies in teaching and learning of mathematics. Comput. Electric. Eng. 94, 107287.
Cheng, K., and Tsai, C. (2020). Students’ motivational beliefs and strategies, perceived immersion and attitudes towards science learning with immersive virtual reality: A partial least squares analysis. Br. J. Educ. Technol. 51, 2139–2158. doi: 10.1111/bjet.12956
Chou, C., Tsai, C., and Tsai, H. (2001). Developing a networked VRML learning system for health science education in Taiwan. Int. J. Educ. Dev. 21, 293–303. doi: 10.1016/S0738-0593(00)00003-1
Chuah, S. H. W. (2019). Why and who will adopt extended reality technology? Literature review, synthesis, and future research agenda. Available online at: http://dx.doi.org/10.2139/ssrn.3300469 (accessed December 13, 2018).
Cowling, M., and Birt, J. (2018). Pedagogy before technology: A design-based research approach to enhancing skills development in paramedic science using mixed reality. Information 9, 29–44. doi: 10.3390/info9020029
Dodevska, Z. A., and Mihic, M. M. (2018). Augmented reality and virtual reality technologies in project management: What can we expect? Eur. Proj. Manage. J. 8, 17–24. doi: 10.23736/S1973-9087.17.04735-9
Donkin, R., and Kynn, M. (2021). Does the learning space matter? An evaluation of active learning in a purpose-built technology-rich collaboration studio. Australas. J. Educ. Technol. 37, 133–146. doi: 10.14742/ajet.5872
Frost, M., Goates, M. C., Cheng, S., and Johnston, J. (2020). Virtual reality. Inf. Technol. Libr. 39, 1–12. doi: 10.6017/ital.v39i1.11369
Güney, Z. (2019). Visual literacy and visualization in instructional design and technology for learning environments. Eur. J. Contemp. Educ. 8, 103–117. doi: 10.13187/ejced.2019.1.103
Hake, R. R. (1998). Interactive-engagement versus traditional methods: A six-thousand-student survey of mechanics test data for introductory physics courses. Am. J. Phys. 66, 64–74.
Hidrogo, I., Zambrano, D., Hernandez-de-Menendez, M., and Morales-Menendez, R. (2020a). Mostla for engineering education: Part 1 initial results. Int. J. Interact. Des. Manuf. 14, 1429–1441. doi: 10.1007/s12008-020-00730-4
Hidrogo, I., Zambrano, D., Hernandez-de-Menendez, M., and Morales-Menendez, R. (2020b). Mostla for engineering education: Part 2 emerging technologies. Int. J. Interact. Des. Manuf. 14, 1461–1473. doi: 10.1007/s12008-020-00729-x
Hite, R. L., Jones, M. G., Childers, G. M., Ennes, M., Chesnutt, K., Pereyra, M., et al. (2019). Investigating potential relationships between adolescents’ cognitive development and perceptions of presence in 3-D, haptic-enabled, virtual reality science instruction. J. Sci. Educ. Technol. 28, 265–284. doi: 10.1007/s10956-018-9764-y
Huang, K., Ball, C., Francis, J., Ratan, R., Boumis, J., and Fordham, J. (2019). Augmented versus virtual reality in education: An exploratory study examining science knowledge retention when using augmented reality/virtual reality mobile applications. Cyberpsychol. Behav. Soc. Netw. 22, 105–110. doi: 10.1089/cyber.2018.0150
Johnson-Glenberg, M. C., Birchfield, D. A., Tolentino, L., and Koziupa, T. (2014). Collaborative embodied learning in mixed reality motion-capture environments: Two science studies. J. Educ. Psychol. 106, 86–104. doi: 10.1037/a0034008
Johnson-Glenberg, M. C., and Megowan-Romanowicz, C. (2017). Embodied science and mixed reality: How gesture and motion capture affect physics education. Cogn. Res. Princ. Implic. 2:24. doi: 10.1186/s41235-017-0060-9
Kennedy-Clark, S. (2011). Pre-service teachers’ perspectives on using scenario-based virtual worlds inscience education. Comput. Educ. 57, 2224–2235. doi: 10.1016/j.compedu.2011.05.015
Klahr, D., Triona, L. M., and Williams, C. (2007). Hands on what? The relative effectiveness of physical versus virtual materials in an engineering design project by middle school children. J. Res. Sci. Teach. 44, 183–203. doi: 10.1002/tea.20152
Lamb, R., Antonenko, P., Etopio, E., and Seccia, A. (2018). Comparison of virtual reality and hands on activities in science education via functional near infrared spectroscopy. Comput. Educ. 124, 14–26. doi: 10.1016/j.compedu.2018.05.014
Langer, K., Lietze, S., and Krizek, G. C. (2021). Vector AR3-App–A good-practice example of learning with augmented reality. Eur. J. Open Distance Elearn. 23, 51–64.
Lindgren, R., Tscholl, M., Wang, S., and Johnson, E. (2016). Enhancing learning and engagement through embodied interaction within a mixed reality simulation. Comput. Educ. 95, 174–187. doi: 10.1016/j.compedu.2016.01.001
Liu, R., Wang, L., Lei, J., Wang, Q., and Ren, Y. (2020). Effects of an immersive virtual reality-based classroom on students’ learning performance in science lessons. Br. J. Educ. Technol. 51, 2034–2049. doi: 10.1111/bjet.13028
Martin-Gonzalez, A., Chi-Poot, A., and Uc-Cetina, V. (2016). Usability evaluation of an augmented reality system for teaching Euclidean vectors. Innov. Educ. Teach. Int. 53, 627–636.
McElhaney, K. W., and Linn, M. C. (2011). Investigations of a complex, realistic task: Intentional, unsystematic, and exhaustive experimenters. J. Res. Sci. Teach. 48, 745–770. doi: 10.1002/tea.20423
Micallef, L., and Rodgers, P. (2014). eulerAPE: Drawing area-proportional 3-Venn diagrams using ellipses. PLoS One 9:e101717. doi: 10.1371/journal.pone.0101717
Miller, M. D., Castillo, G., Medoff, N., and Hardy, A. (2021). Immersive VR for organic chemistry: Impacts on performance and grades for first-generation and continuing-generation university students. Innov. High. Educ. 46, 565–589. doi: 10.1007/s10755-021-09551-z
Milgram, P., and Kishino, F. (1994). A taxonomy of mixed reality visual displays. IEICE Trans. Inf. Syst. 77, 1321–1329.
Moro, C., Phelps, C., Redmond, P., and Stromberga, Z. (2021). HoloLens and mobile augmented reality in medical and health science education: A randomised controlled trial. Br. J. Educ. Technol. 52, 680–694. doi: 10.1111/bjet.13049
Moro, C., Štromberga, Z., Raikos, A., and Stirling, A. (2017a). The effectiveness of virtual and augmented reality in health sciences and medical anatomy. Anat. Sci. Educ. 10, 549–559. doi: 10.1002/ase.1696
Moro, C., Stromberga, Z., and Stirling, A. (2017b). Virtualisation devices for student learning: Comparison between desktop-based (oculus rift) and mobile-based (gear VR) virtual reality in medical and health science education. Australas. J. Educ. Technol. 33, 1–10. doi: 10.14742/ajet.3840
Pan, Z., Cheok, A. D., Yang, H., Zhu, J., and Shi, J. (2006). Virtual reality and mixed reality for virtual learning environments. Comput. Graph. 30, 20–28.
Paxinou, E., Panagiotakopoulos, C. T., Karatrantou, A., Kalles, D., and Sgourou, A. (2020). Implementation and evaluation of a three-dimensional virtual reality biology lab versus conventional didactic practices in lab experimenting with the photonic microscope. Biochem. Mol. Biol. Educ. 48, 21–27. doi: 10.1002/bmb.21307
Poland, R., Baggott La Velle, L., and Nichol, J. (2003). The virtual field station (VFS): Using a virtual reality environment for ecological fieldwork in A-level biological studies–case study 3. Br. J. Educ. Technol. 34, 215–231. doi: 10.1111/1467-8535.00321
Sahin, D., and Yilmaz, R. M. (2020). The effect of augmented reality technology on middle school students’ achievements and attitudes towards science education. Comput. Educ. 144:103710. doi: 10.1016/j.compedu.2019.103710
Scherer, R., and Tiemann, R. (2012). Factors of problem-solving competency in a virtual chemistry environment: The role of metacognitive knowledge about strategies. Comput. Educ. 59, 1199–1214. doi: 10.1016/j.compedu.2012.05.020
Schönborn, K. J., Bivall, P., and Tibell, L. A. E. (2011). Exploring relationships between students’ interaction and learning with a haptic virtual biomolecular model. Comput. Educ. 57, 2095–2105. doi: 10.1016/j.compedu.2011.05.013
Schönborn, K. J., Höst, G. E., and Palmerius, K. E. L. (2016). Nano education with interactive visualization. Nano Today 11, 543–546. doi: 10.1016/j.nantod.2015.10.006
Schutera, S., Schnierle, M., Wu, M., Pertzel, T., Seybold, J., Bauer, P., et al. (2021). On the potential of augmented reality for mathematics teaching with the application cleARmaths. Educ. Sci. 11:368. doi: 10.3390/educsci11080368
Setareh, M., Bowman, D. A., Kalita, A., Gracey, M., and Lucas, J. (2005). Application of a virtual environment system in building sciences education. J. Archit. Eng. 11, 165–172. doi: 10.1061/(ASCE)1076-0431200511:4(165)
Shin, Y. (2002). Virtual reality simulations in web-based science education. Comput. Appl. Eng. Educ. 10, 18–25. doi: 10.1002/cae.10014
Tang, Y. M., Au, K. M., Lau, H. C., Ho, G. T., and Wu, C. H. (2020). Evaluating the effectiveness of learning design with mixed reality (MR) in higher education. Virtual Real. 24, 797–807. doi: 10.1007/s10055-020-00427-9
Xie, C., and Lee, H. (2012). A visual approach to nanotechnology education. Int. J. Eng. Educ. 28, 1006–1018.
Appendix
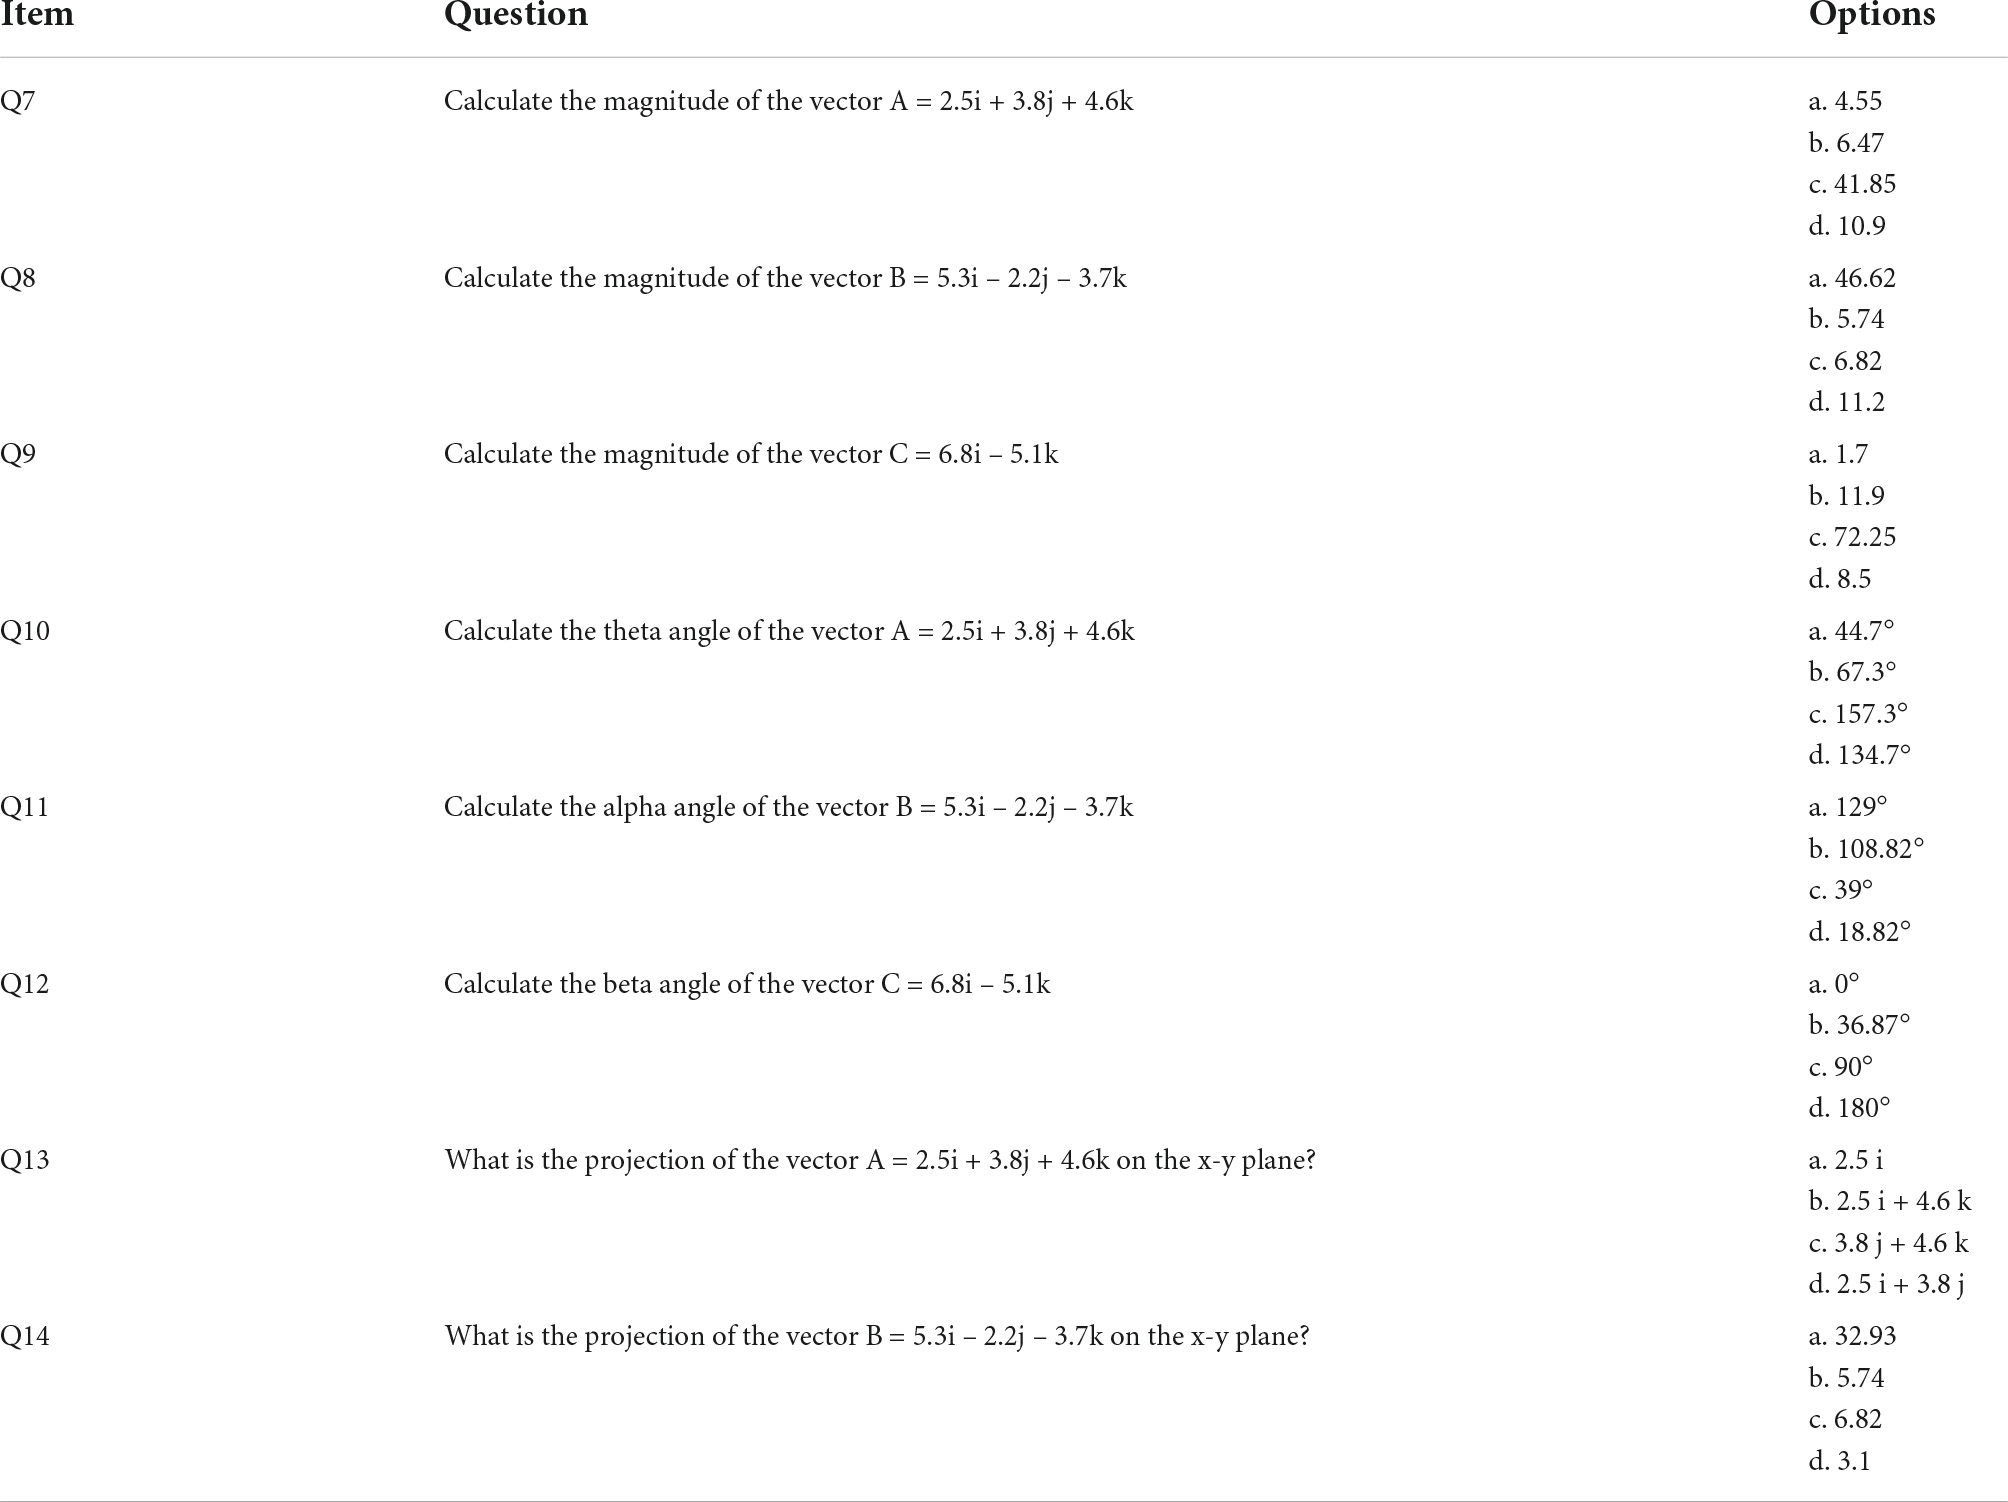
Appendix Table 1. Eight multiple-choice questions that required explicit computation of magnitude and projection of specific vectors.
Keywords: stem education, virtual reality, vectors, educational innovation, higher education
Citation: Campos E, Hidrogo I and Zavala G (2022) Impact of virtual reality use on the teaching and learning of vectors. Front. Educ. 7:965640. doi: 10.3389/feduc.2022.965640
Received: 10 June 2022; Accepted: 01 September 2022;
Published: 27 September 2022.
Edited by:
Stylianos Mystakidis, Hellenic Open University, GreeceReviewed by:
Osvaldo Gervasi, University of Perugia, ItalyJorge C. S. Cardoso, University of Coimbra, Portugal
Copyright © 2022 Campos, Hidrogo and Zavala. This is an open-access article distributed under the terms of the Creative Commons Attribution License (CC BY). The use, distribution or reproduction in other forums is permitted, provided the original author(s) and the copyright owner(s) are credited and that the original publication in this journal is cited, in accordance with accepted academic practice. No use, distribution or reproduction is permitted which does not comply with these terms.
*Correspondence: Genaro Zavala, genaro.zavala@tec.mx