Article

Specific Gene Expression in Pseudomonas Putida U Shows New Alternatives for Cadaverine and Putrescine Catabolism

by
Luis Getino
,
Alejandro Chamizo-Ampudia
,
José Luis Martín
,
José María Luengo
,
Carlos Barreiro
and
Elías R. Olivera
*
Área de Bioquímica y Biología Molecular, Departamento de Biología Molecular, Universidad de León, 24007 León, Spain
*
Author to whom correspondence should be addressed.
These authors contributed equally to this work and should be considered co-first authors.
Genes 2023, 14(10), 1897; https://doi.org/10.3390/genes14101897
Submission received: 15 August 2023 / Revised: 20 September 2023 / Accepted: 27 September 2023 / Published: 30 September 2023
(This article belongs to the Section Genes & Environments)

Abstract

:
Pseudomonas putida strain U can be grown using, as sole carbon sources, the biogenic amines putrescine or cadaverine, as well as their catabolic intermediates, ɣ-aminobutyrate or δ-aminovalerate, respectively. Several paralogs for the genes that encode some of the activities involved in the catabolism of these compounds, such as a putrescine-pyruvate aminotransferase (spuC1 and spuC2 genes) and a ɣ-aminobutyrate aminotransferase (gabT1 and gabT2 genes) have been identified in this bacterium. When the expression pattern of these genes is analyzed by qPCR, it is drastically conditioned by supplying the carbon sources. Thus, spuC1 is upregulated by putrescine, whereas spuC2 seems to be exclusively induced by cadaverine. However, gabT1 increases its expression in response to different polyamines or aminated catabolic derivatives from them (i.e., ɣ-aminobutyrate or δ-aminovalerate), although gabT2 does not change its expression level concerning no-amine unrelated carbon sources (citrate). These results reveal differences between the mechanisms proposed for polyamine catabolism in P. aeruginosa and Escherichia coli concerning P. putida strain U, as well as allow a deeper understanding of the enzymatic systems used by this last strain during polyamine metabolism.

1. Introduction

In 2017, the World Health Organization (WHO) estimated that there were 600 million cases of illness caused by unsafe food, with the death of 420,000 people each year. Food quality is an important factor that must be considered to safeguard the health of consumers [1]. Foodborne illnesses can be caused by bacteria, viruses, parasites, contaminants, or allergens, among others. Although these organisms are the main causes of food poisoning, the presence of molecules of biological origin, such as mycotoxins, aflatoxins, or biogenic amines, is of great importance as a marker of food safety [2]. Thus, due to their toxigenic potential, the presence and concentration of biogenic amines and polyamines in food require strict control [2]. These amines can be found in foods that have undergone biological processing, being present in fermented beverages such as wine and beer, dairy products (cheese, yogurt, or fermented milk), fresh fish and fishery products, or meat and meat products [3,4,5,6,7]. Moreover, the food occurrence of these compounds can be related to improper handling and storage [8].
On the other hand, polyamines are present in physiologically appropriate concentrations in almost all organisms, where they are involved in a variety of cellular processes, such as gene regulation, survival, stress response, fulfilling biochemical roles in the synthesis, maintenance, and stability of nucleic acids and proteins [9,10,11]. However, intracellular polyamine concentrations show variations between cells and organisms. Thus, depending on the activation state of murine macrophages, putrescine, spermidine, and spermine have been documented to range from 250 to 1750 pmol determined in 5 × 10⁶ macrophages. On the other hand, concentrations of putrescine in E. coli have been documented in a range from 10 to 30 mM, although in other bacteria, the determined content ranged between 0.1 and 0.2 mM [12]. Moreover, polyamines seem to be very ubiquitous molecules that have also been found in humus in nM concentrations per gram of sample, with an ecotoxicological effect, because an increase in these concentrations could trigger variations on the microbiota from these soils due to toxic effects over some of the bacteria present [13].
It has been well documented that an exogenous consumption of these compounds from spoiled food could promote adverse effects on human health, triggering deleterious effects and causing specific symptoms. Moreover, the concentration of polyamines exceeding physiological levels in the human body has been reported to be linked to tumoral, inflammatory, and apoptotic events and also to specific infections, mainly by intracellular pathogens [14,15,16].
In addition to their endogenous production fulfilling physiological functions, some bacteria can use polyamines as a carbon and/or nitrogen source through different pathways to support growth and functionality, as has been documented in model organisms such as Escherichia coli, P. aeruginosa, and Streptomyces coelicolor [17,18]. On these pathways, catabolism of putrescine and cadaverine always leads to the production of ɣ-aminobutyrate (GABA) and δ-aminovalerate (DAVA) as metabolic intermediates, respectively (Figure 1). Interestingly, it has also been documented that putrescine at low concentrations (0.15 mM) could be toxic for Anacystis nidulans [19]. In E. coli K12, two proteins have been described: a YgjG (putrescine aminotransferase) able to deaminate putrescine, cadaverine, and, with lower efficiency, spermidine [20], and a YdcW, a ɣ-aminobutyraldehyde dehydrogenase which oxidates the aldehyde generated after deamination to render a nonproteinogenic amino acid (GABA or DAVA) that will be later integrated into the general metabolism of the microorganism using specific enzymatic functions [21].
Likewise, an alternative route for polyamine catabolism has also been described in E. coli K12, which involves the generation of ɣ-glutamyl intermediates [22]. This process starts through the use of an ATP-dependent ɣ-glutamyl putrescine synthetase (PuuA), linking a glutamate molecule to one of the amino groups from putrescine. Subsequently, PuuB (ɣ-glutamyl putrescine oxidoreductase) eliminates the free amino group, producing an aldehyde derivative. This aldehyde, through the action of a NAD(P)-dependent aldehyde dehydrogenase (PuuC) and a ɣ-glutamyl-ɣ-aminobutyrate hydrolase (PuuD), results in the final product GABA, with the concomitant recycling of glutamate [22]. However, this metabolic pathway has not been fully described, although it has been observed that PuuA can recognize cadaverine as a substrate, undoubtedly linking the puu genes with cadaverine catabolism [23]. Notably, studies with E. coli K12 strains affected in the puuA, puuB, and puuC genes, as well as the ygjG and ydcW genes, reveal the existence of two independent sets of enzymes capable of completely biotransforming putrescine into succinate [24]. Studies on GABA degradation have reported the existence of several paralogs of gabT and gabD, with at least one copy of gabT being inducible by polyamines and catabolic intermediates and another whose expression is not affected by putrescine, cadaverine, and their intermediates [25].
Similarly, in P. aeruginosa PAO1, the existence of analogous pathways to those found in E. coli has been suggested. Regarding the deamination of putrescine or ɣ-glutamyl putrescine, both reactions are catalyzed by SpuC (putrescine-pyruvate aminotransferase), which utilizes pyruvate as a substrate, generating alanine [17,26]. However, it has been shown that other genes participate at this point, such as pauB, indicating the complexity of the catabolic pathways in P. aeruginosa PAO1 [27,28]. Four genes encoding γ-glutamyl-polyamine deamination enzymes capable of releasing free ammonium from polyamines have been identified. Studies in mutants lacking the spuC and the pauB1-4, although expressing different pauB genes, show the ability of this strain to grow using putrescine as the sole carbon source. Thus, strain derivatives expressing pauB1, pauB3, or spuC were able to grow using putrescine, whereas the growth on cadaverine was recovered by the expression of pauB1 or spuC [29].
Finally, Chou et al. demonstrated, through transcriptome analysis, the presence of ɣ-aminobutyrate aminotransferases (gabT), whose expression is linked to the presence of putrescine in the medium [27].
These data strongly suggest that there are different proteins involved in the GABA and DAVA catabolism in both Pseudomonas and Escherichia. Also, they reflect a complex mechanism of differential expression of all the genes involved.
Moreover, it has to be considered that some E. coli and P. aeruginosa strains are pathogens for human beings. Considering that, it could be feasible that polyamine catabolism in these bacteria could show us new therapeutic targets for the treatment of these infections. Taking this in mind, any contribution to mechanistic issues and alternatives for the degradation of polyamines by microorganisms should be welcome.
P. putida strain U has been used as the main model to define biogenic amine degradation (phenylethylamine, tyramine, dopamine, histamine, and others) [30,31,32]. Thus, considering the deleterious effects that an overdose of polyamines from unsafe food could have on human beings, as well as the potential use of the microbial catabolic pathways for these compounds as targets for the treatment of infections, we aimed to study the degradation of these kinds of compounds in this model bacteria. Although this bacterium could not be included in the food chain and has not been related to infective processes, it provides interesting catabolic alternatives that could contribute to a better understanding of polyamine metabolism. Thus, in this study, we describe the existence of different paralog genes coding putrescine-pyruvate aminotransferase and ɣ-aminobutyrate aminotransferase activities. Moreover, we analyze the differential expression of these genes in response to the presence of cadaverine, putrescine, or catabolic derivatives from them (γ-aminobutyrate and δ-aminovalerate), which allows us to suggest that cadaverine and putrescine metabolism in P. putida U could show an increase in complexity, at least in some of the steps of the catabolic routes.

2. Materials and Methods

2.1. Biochemical Reagents

Biochemical reagents (media, antibiotics, and carbon sources) were purchased from Condalab (Madrid, Spain), Sigma-Aldrich (San Luis, MO, USA), Alfa-Aesar (Haverhill, MA, USA), and Acros Organic (Geel, Belgium). Molecular biology products were supplied by Thermo Scientific (Waltham, MA, USA) and Quiagen (Hilden, Germany). Other products used were supplied by Thermo Scientific (Waltham, MA, USA) and VWR (Radnor, PA, USA) with analytical quality or high-performance liquid chromatography (HPLC) grades. Macrogen (Seoul, Pepublic of Korea) provided the oligonucleotides. Molecular biology reagents were supplied by Promega (Madison, WI, USA) and Applied Biosystem (Waltham, MA, USA).

2.2. Microorganisms and Culture Conditions

The main strain used in this study is Pseudomonas putida U (Colección Española de Cultivos Tipo, CECT4848), a Gram-negative bacterium that exhibits resistance to rifampicin (25 µg/mL), ampicillin (100 µg/mL), and chloramphenicol (30 µg/mL).
For routine maintenance, the strain was grown at 30 °C on LB plates containing 2% (w/v) agar and supplemented with rifampicin [33]. For liquid cultures, Pseudomonas was previously grown in minimal medium (MM) plates supplemented with 10 mM citrate and rifampicin and containing 2% (w/v) agar [34].
To initiate experiments, an inoculum was prepared in the liquid minimal medium under the same conditions as the solid culture and incubated with agitation at 250 rpm and 30 °C along the needed time for each experiment. The growth kinetics and gene expression analysis were carried out using cultures made in 500 mL flasks containing 100 mL of minimal medium supplemented with the carbon sources of interest (citrate, putrescine, GABA, cadaverine, or DAVA) at a concentration of 10 mM, 250 rpm shaking, and 30 °C temperature in the incubator. Selected strains for each experiment were seeded at an optical density (OD) of 0.05 measured at 540 nm, and the growth was determined periodically as an increase in the absorbance at 540 nm. In some experiments, cultures in minimal media containing the corresponding carbon sources at a concentration of 10 mM were supplied with 1mM of cadaverine or putrescine, used as a potential inducer of specific metabolism.
The E. coli DH10B derivative strains were maintained on LB agar plates and cultured overnight at 37 °C. Specific antibiotics were used at the needed concentrations, and 80 µg/ml 5-bromo-4-chloro-3-indolyl-beta-D-galactopyranoside (X-gal) and 50 µM isopropyl-beta-D-1-thiogalactopyranoside (IPTG) were supplied in the media for the selection of strains carrying the pGEM-T Easy plasmid (Promega).

2.3. Design of Primers for qPCR

Using the 16S rRNA sequence from P. putida U (JN695040), through a BLAST search against GenBank (NCBI, https://blast.ncbi.nlm.nih.gov/Blast.cgi; last accessed 17 July 2023), different strains with the highest percentage identity were identified. Among the strains with the highest 16S rDNA identity to P. putida U, specific strains were selected to identify the putative highest identity for previously published genes from P. putida U. The best matches in the comparison were identified in the genomes from P. putida G7 (CP096581), P. putida S13.1.2 (CP010979), P. putida strain B1 (CP022560), P. putida KF715 (AP015029), P. putida strain GMI12077 (CP114035), P. putida B21-029 (CP087183), P. putida strain ATCC12633 (CP101910), and P. putida NBRC 14164 (AP013070). Once the genome with the highest identity was selected, it was used for qPCR primer design. The alignment of selected sequences was carried out using Bioedit software version 7.2.6.1 (Carlsbad, CA, USA) with native ClustalW (version 1.4, Heidelberg, Germany) [35], aligning the qPCR-amplified sequences to the P. putida G7 target genes.
The phylogenetic trees were constructed using the Molecular Evolutionary Genetics Analysis (MEGA) v.11.0.3 software (https://www.megasoftware.net/; Tokyo, Japan) [36,37]. Alignments of the coding genes were performed with Clustal Omega (default parameters) [38]. Phylogenetic trees were constructed using the Neighbor-Joining method [39] with the Kimura-2 parameter model [40] and the Maximum Likelihood method [41]. Bootstrap consensus trees [42] were inferred from 1000 replicates. Considering the close identity of most of the protein sequences, the use of the whole coding gene sequences was preferred. Gaps between sequences were pairwise deleted.

2.4. Gene Induction and RNA Extraction

To induce specific genes, P. putida U was cultured in the liquid minimal medium as previously described, containing as carbon sources citrate, putrescine, cadaverine, GABA, and DAVA at a final concentration of 10 mM.
For the isolation of total RNA, 10 mL of the medium was collected at an absorbance of 0.6 (corresponding to the start of the logarithmic phase of growth). Cell pellets were immediately frozen at −80 °C until the processing of the samples. The RNA was extracted using the Roche High Pure RNA Isolation Kit, and DNase treatment was performed using RNase-free Invitrogen Turbo DNase to ensure genomic DNA removal. To verify genomic DNA cleanliness, PCR checks were conducted to ensure the quality of the isolated RNA.
cDNA synthesis was performed from 5 µg of total RNA using the Thermo Scientific Maxima H Minus First Strand cDNA Synthesis Kit with random primers. The resulting cDNA was quantified using a Nanodrop 2000 (Thermo Scientific, Wilmington, DE, USA).

2.5. Standardizing qPCR

Analysis of the genes involved in putrescine and cadaverine degradation was conducted through relativization of the expression levels from the samples obtained as described from cultures induced by putrescine, cadaverine, or GABA concerning their expression using citrate. qPCR was performed using the Step One system (Applied Biosystems, Foster City, CA) with a final reaction volume of 20 μL [43,44]. The reaction mixture comprised 10 μL of Power SYBR Green PCR Master Mix (Applied Biosystems; Foster City, CA, U.S.A), 1 μL of 5 μmol/L Forward Primer, 1 μLof 5 μmol/L Reverse Primer (Table 1), 1 μL of 50 ng/μL cDNA, and water up the final volume of 20 μL.
Reference housekeeping genes were selected based on previous studies in other Pseudomonas species [45,46], and their Ct values were verified under experimental conditions. The chosen housekeeping genes were rpoD (σ70 transcriptional factor) and rpoN (σ54 transcriptional factor).
Each pair of primers designed was checked for its efficiency to ensure it fell between 90% and 110% (Table 1). Additionally, the amplicon size was verified using agarose gel electrophoresis and through Sanger sequencing (Figure 4 and Supplementary Figure S1).
Ct values of each of these genes were analyzed on each condition. Subsequently, the ΔCt from the combination of housekeeping genes was calculated on each condition to assess deviations in their values. Genes with the most stable Ct values and minimal standard deviation in their Ct increments among different conditions were selected. The analysis was performed using GraphPad Prism v. 6 software (GraphPad Software, Inc, Boston, MA, USA).
The specific primer sequences, annealing temperatures, and amplification efficiencies used in this work are provided in Table 1.
The qPCR quantification performed was relative to the expression of these genes in the presence of succinate. The formula 2^(−(ΔCt target gene −ΔCt reference gene)) was applied for relative quantification [47]. Four biological replicates were conducted to enable statistical analysis. The gene expression value in the presence of citrate was considered as the reference value (1) for normalization. GraphPad Prism 6 software (San Diego, CA, USA) was used to determine the significance of the differences observed.

2.6. Validation of qPCR Amplicons

The qPCR product was treated following the protocol described by Sambrook and Russel (2001). The DNA fragment was purified from an agarose gel (2.5%, w/v) using the QIAGEN GmbH purification kit. The amplified fragment was then cloned into the pGEM-T easy plasmid (Promega) for the cloning of qPCR amplicons from P. putida U cDNA transcripts.
Transformation of chemically competent cells from the E. coli DH10B strain was carried out using the RbCl method [48]. Plasmid extraction from the E. coli DH10 B-derived strains was performed using the QIAGEN GmbH miniprep (Antwerp, Belgium) extraction kit. Plasmid concentration and purity were determined using a Nanodrop model 6345 spectrophotometer from Thermo Fisher.
Finally, selected plasmids were sequenced using universal m13 primers flanking the multiple cloning sites from pGEM-T easy (Promega). Sanger sequencing of the different plasmids was performed by Secugen S.L. (Madrid, Spain). Sequences from the amplicons determined in this work (Figure S1) from P. putida U genomic DNA have been deposited in GenBank under accession numbers spuC1 (OR435851), spuC2 (OR435852), gabT1 (OR435853), gabT2 (OR435854), rpoD (OR435855), rpoN (OR435856), and recA (OR435857).

3. Results

3.1. Growth of P. putida U Using Putrescine, Cadaverine, GABA, DAVA, or Citrate as Carbon Sources

The ability of the Pseudomonas putida strain U to metabolize polyamines and their metabolic intermediates was studied. For this purpose, P. putida was cultured in MM supplemented with different carbon sources (citrate, putrescine, GABA, cadaverine, and DAVA, 10 mM). The different carbon sources were used to verify the ability of P. putida U to use putrescine, cadaverine, and their degradation intermediates GABA and DAVA to support its growth (Figure 2). Moreover, this would allow us to start checking the degradative pathway(s) from P. putida U.
It was observed that P. putida U wild type was able to grow using all provided carbon sources (Figure 2A,B). The most prominent differences were observed in the duration of the lag phase when using different compounds. Thus, when P. putida U used putrescine or GABA, entry into the logarithmic phase of growth began at 8 hours, while with cadaverine or DAVA, growth was delayed at 20 hours. The latency phase was similar when cadaverine or DAVA were used, as it is with putrescine and GABA.
Once these results were verified, a second growth was performed, where all the previous growth conditions were repeated, though 1 mM putrescine was added, and control with only 1 mM putrescine was used to find out what the maximum absorbance of P. putida U growth would be (Figure 2C–F). The rationale of this addition was to check the possibility that 1mM putrescine could induce some genes that could also contribute to more efficient degradation of cadaverine and the other compounds. It was observed that both DAVA and cadaverine advanced their times when 1 mM putrescine was added to the medium. It should be noted that in similar experiments, the addition of 1mM cadaverine did not affect the profile of the growth curves. This finding suggested that the metabolism of cadaverine and putrescine could have some differences between them. Thus, as a first approach, the expression of the genes related to the deamination of polyamines and their putative derivatives (spuC and gabT) was proposed since these deamination processes had been proposed as the starting of polyamine, or GABA and DAVA, catabolism.

3.2. Search for Pseudomonas Putida U Homologous Genomes

To verify whether this improved growth is due to increased expression of the spuC and gabT genes, qPCR oligonucleotide primers were designed. However, considering that the genome of P. putida U was not available, these oligonucleotides had to be designed using a sequenced genome showing the highest identity to known sequences from P. putida U.
The first approach was to search for organisms with sequenced genomes that showed high identity with the 16S rRNA of P. putida U (Supplementary Table S1). Thus, different P. putida strains were selected, and alignment of P. putida U published sequences within each available allowed the selection of which of these P. putida strains showed the highest identity with P. putida U (Supplementary Table S2). After all the comparisons were made, the genome of P. putida G7 was selected because it showed the highest identity with all the known sequences determined in P. putida U.

3.3. Identification, Optimization, and Testing of qPCR Primers for SpuCs, GabTs, and Housekeeping Genes in P. putida U

Once the genome with the highest identity for designing qPCR primers for P. putida U was selected (P. putida G7 genome, CP096581), the spuC and gabT genes described in P. putida KT2440 and S12 and in P. aeruginosa were searched and identified in the P. putida G7 genome. Thus, two putative paralogs to spuC (named here as spuC1 and spuC2) and two possible gabTs (indicated as gabT1 and gabT2) were identified in P. putida G7 (Figure 3). Using the sequences from the G7 strain, qPCR primers were designed for each of them.
These putative spuCs and gabTs were used to design several pairs of primers for each studied gene in P. putida U. These pairs were based on different parts of the corresponding genes to then optimize and check the most optimal versions to be used in qPCR studies using the nucleic acids from P. putida U (Table 1 and Figure 4).
According to the phylogenetic trees performed using the gabTs genes (Figure 3A), as expected from the sequence conservation observed in the alignments, two different clades could be observed, one corresponding to gabT1 sequences and the other to gabT2. It is noticeable at two different points: (i) gabT1 from E. coli K12 showed a lower phylogenetic relationship with the sequences from pseudomonads, although clustering together, and in the same clade containing puuE (the corresponding gene to gabT2 in the other bacteria) also from E. coli, suggesting a conserved relationship between these two paralogs; (ii) gabT2 from P. aeruginosa PAO1 outgroups from both clades, suggesting a “relaxed” maintaining of the sequence concerning both gene groups and, putatively, the most dissimilar gene participating on these mechanisms.
In Figure 3B, a similar division into two different clades can be observed, showing that spuC1 genes maintain a coherent evolutive distribution and that spuC2 also maintains conservation between them. Thus, this suggests, due to the proximity of the two clades, that both genes arose from duplication and are maintained in the strains, at least in P. putida. However, ygjG from E. coli shows a clear evolutive difference from the other putrescine transaminase analyzed.
Expression analysis of genes related to the putative spuC1 and spuC2 from P. putida U was studied. The optimization of several pairs of primers for each spuC was performed, and one pair for each gene was selected based on their optimal performance (Figure 4). Furthermore, amplicons obtained using these primers were sequenced and aligned with the corresponding spuCs from the P. putida G7 genome (Supplementary Figure S1A,B).
A similar procedure was applied to the putative gabT1 and gabT2. A specific pair of oligonucleotides was chosen for each gabT (Table 1). Sequencing of the amplicons obtained from P. putida U gabTs showed high identity to the gabTs in P. putida G7 (Supplementary Figure S1C,D).
Housekeeping gene selection was performed based on bibliographic references in other Pseudomonas species, with the rpoN54 factor), rpoD70 factor), and recA (recombinase A) genes identified as the most suitable [45,46].
For these housekeeping genes, several pairs of primers were designed based on the P. putida G7 sequence. Once these oligonucleotide pairs were tested, a pair was selected for each housekeeping gene (Table 1). The corresponding qPCR amplicons were analyzed by sequencing, showing high homology with the housekeeping genes identified in P. putida G7 (Supplementary Figure S1). After the selection of the oligonucleotide pairs, these were used to study the variation presented by each possible housekeeping gene under all study conditions, ultimately selecting only two housekeeping genes (rpoN and rpoD) based on their high stability in the study conditions, in agreement with different studies from other laboratories [45,46].

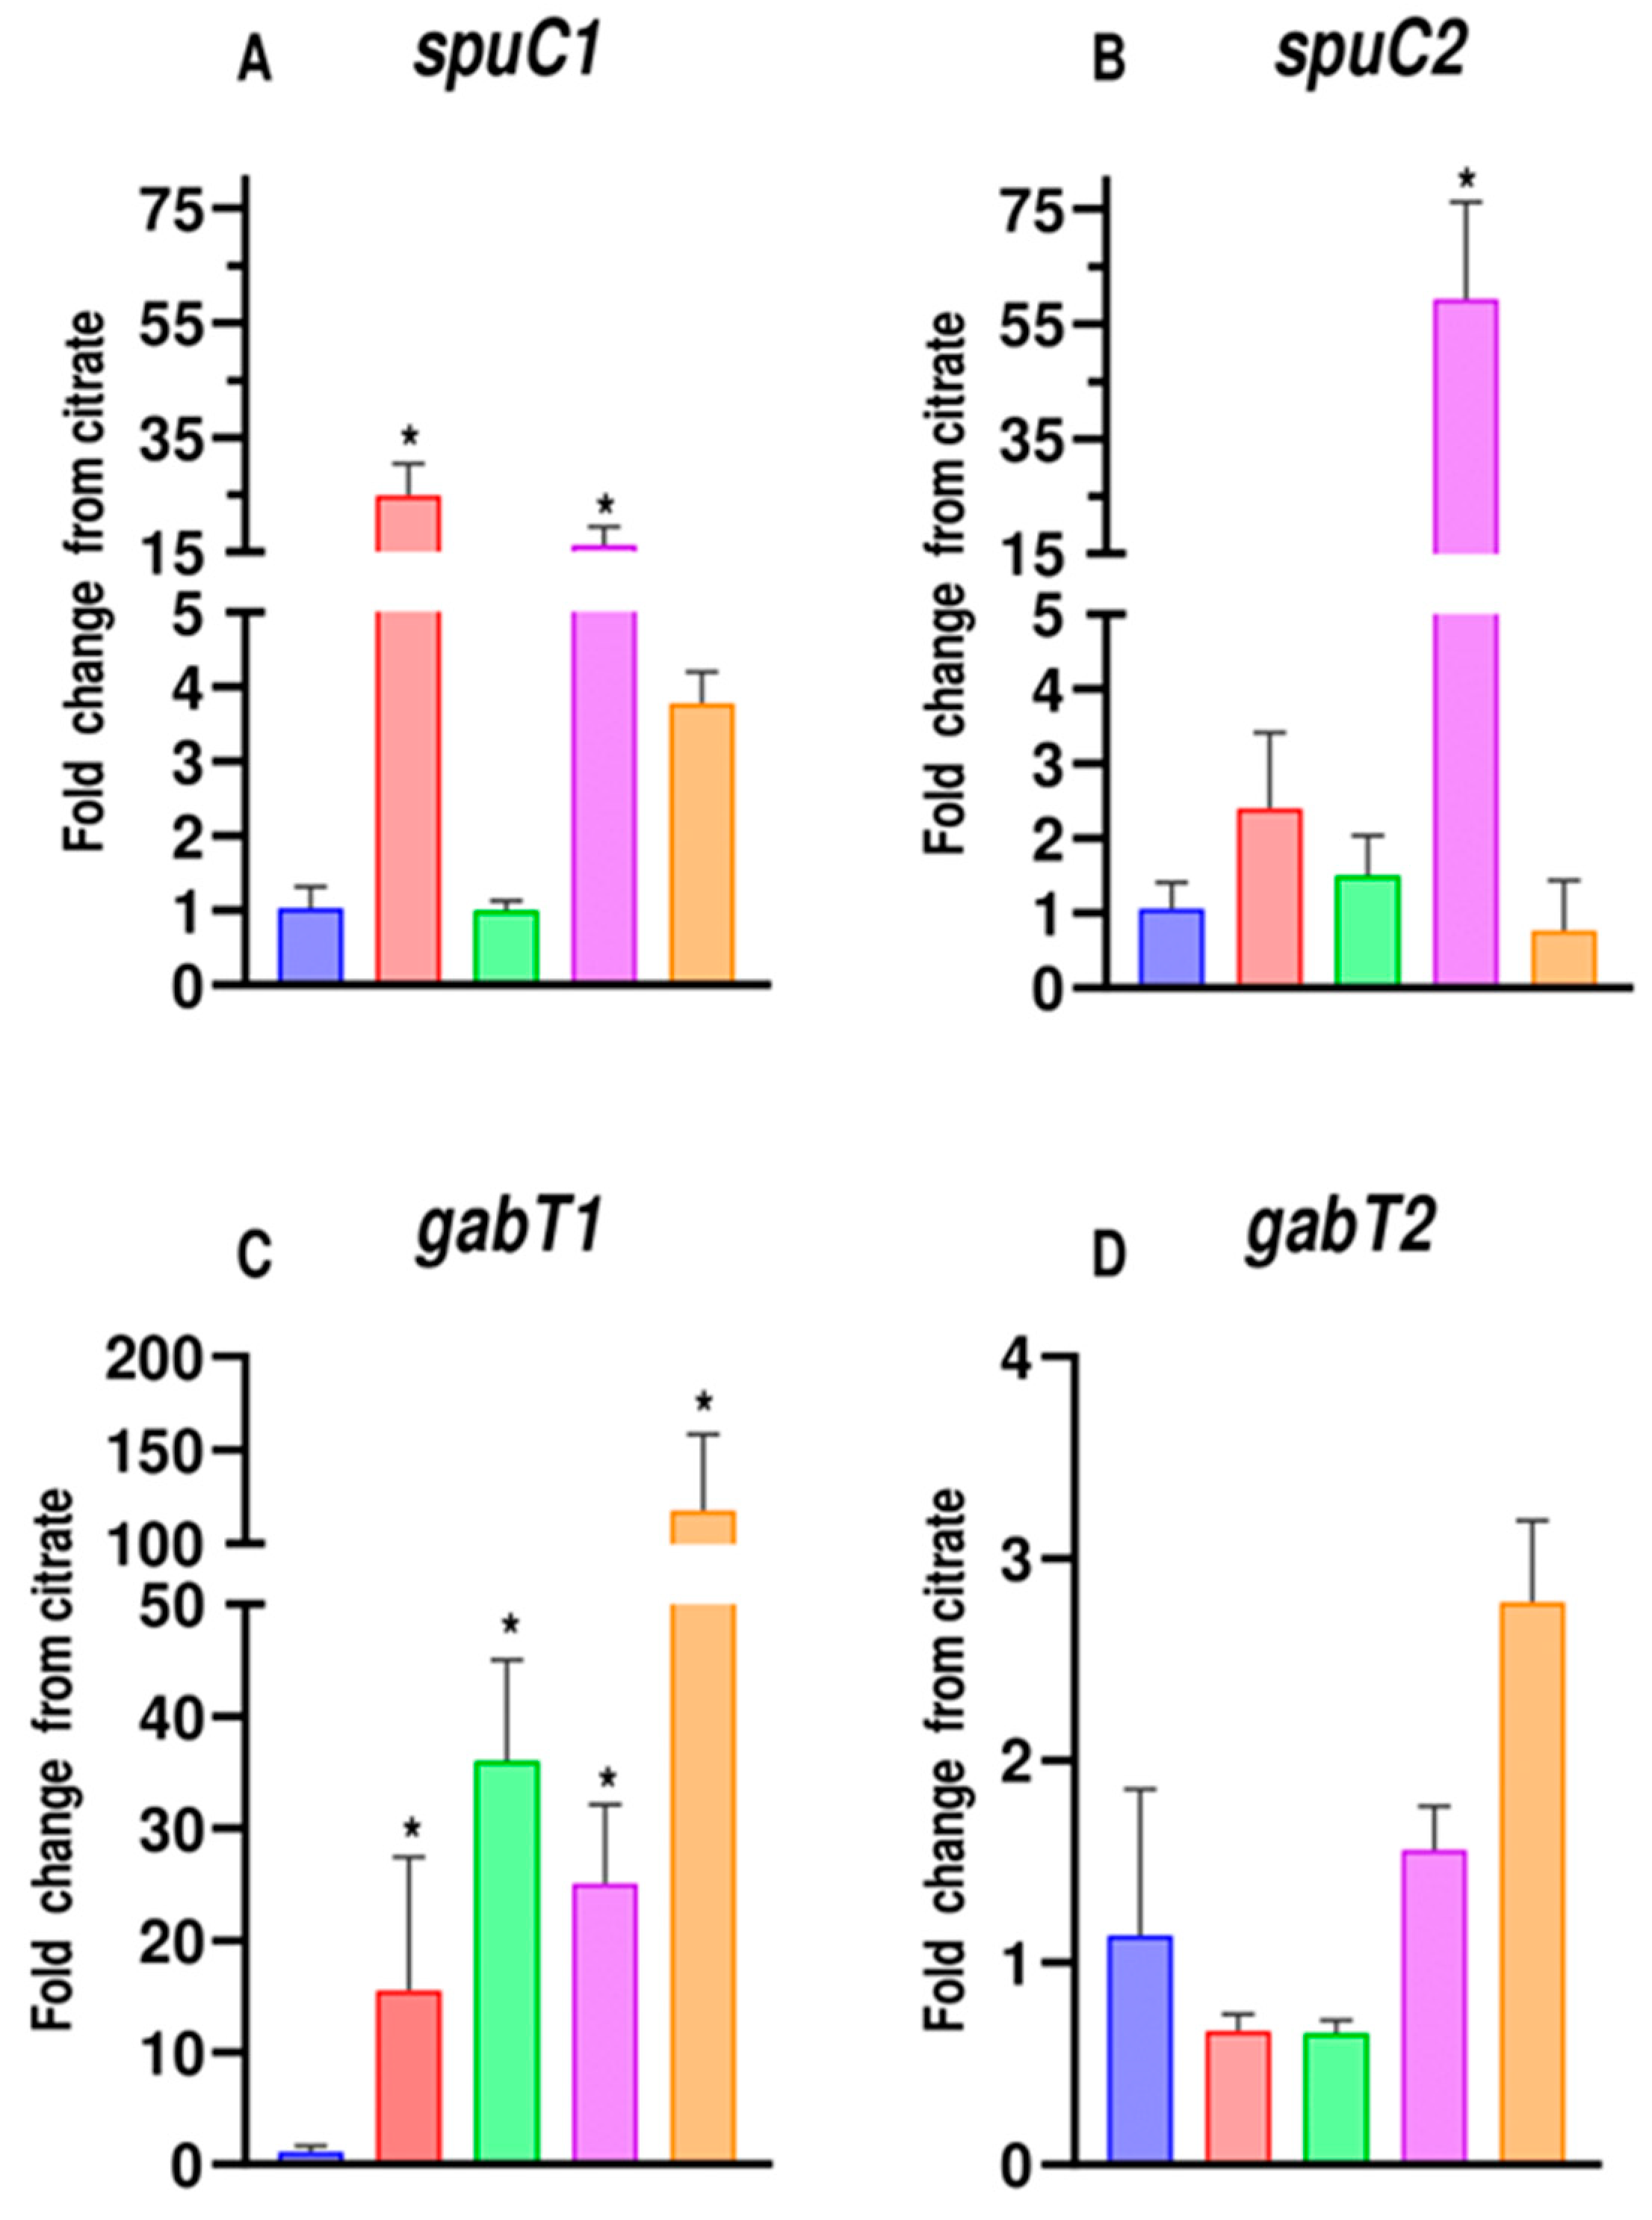
3.4. Expression Study of SpuCs and GabTs in Pseudomonas Putida U

The analysis was based on the study of the expression of each of the genes spuC1, spuC2, gabT1, and gabT2 in media with 10 mM citrate as the control, 10 mM putrescine, 10 mM cadaverine, 10 mM GABA, and 10 mM DAVA. All conditions were referenced to the control condition (10 mM citrate).
After normalization of the results obtained from the qPCR concerning the expression of the selected housekeeping genes, upregulation of both spuC1 and spuC2 was observed when the bacteria were cultured using cadaverine or DAVA. However, only spuC1 was upregulated in those media containing putrescine or GABA. Profile of regulation of these genes in the presence of GABA and DAVA makes sense, considering that both compounds are catabolic intermediates in the degradative pathways of the corresponding polyamines. Moreover, spuC2 was only induced with cadaverine and not with putrescine (Figure 5A,B).
Furthermore, the expression of gabT1 appears to be increased compared to citrate in putrescine, GABA, cadaverine, and DAVA. In contrast, gabT2 seems to be unaffected in expression relative to citrate with putrescine, GABA, cadaverine, and DAVA (Figure 5C,D).
Overall, the study identifies two spuC paralogs and verifies that the promoter triggering the expression of spuC2 responded exclusively, in the conditions tested, to the presence of cadaverine, whereas the control of spuC1 promoter seems to be more relaxed for the presence of different polyamines. The results shed light on the expression patterns of these genes under different conditions, providing valuable insights into their functions in the degradation pathway of amines.

3.5. Analysis of the Putative Cluster Containing SpuC1

After the qPCR analysis and regarding the growth curves, it is evident that spuC1 is induced by putrescine, thereby enhancing the degradation efficiency of cadaverine and DAVA, as observed in the growth curves. However, the literature indicates that the spuC genes are capable of producing the deamination of both putrescine and cadaverine [29,49]. Thus, one potential way for putrescine to improve the growth using DAVA as a carbon source could be through transportation. Indeed, the PotABCD transporters, as supported by the literature, are proficient in transporting various polyamines and primary amines [50].
For this reason, a study on the adjacent genes to spuC1 in P. putida G7 was conducted, showing that the ABC-like transporter genes possibly belong to the same cluster as spuC1. A similar finding has been documented as happens in P. aeruginosa PAO1, where transport genes have been described to be under the control of the same promoter between spuI and spuA, where it expresses all spuABCDEFGH genes [26]. The main difference between P. putida G7 and P. aeruginosa corresponds to the synteny of the spuA gene since, in P. putida G7, this gene is located in a cluster close to the spuC2 gene. This rearrangement suggests the possibility of a potential increase in the expression levels of both the transport system and spuC1 in response to the presence of putrescine (Figure 6). Thus, the heightened activation of the spuC1 cluster expression could be potentially attributed to a higher efficiency of the uptake of putrescine by the periplasmic PotF protein compared to cadaverine [51].

4. Discussion

Pseudomonas putida U is a bacterium known for its outstanding degradative ability, especially towards various amines [17]. This study demonstrated its capacity to degrade compounds such as putrescine, cadaverine, and their degradation intermediates GABA and DAVA, as described in other organisms [17,27,28,52,53].
The obtained results regarding the growth of P. putida U in different amines present relevant data, such as different growth times between putrescine/GABA and cadaverine/DAVA. Although previous studies suggest the same degradation pathway for putrescine and cadaverine, they do not mention differences in the efficiency of degradation for these amines and relatives to grow [29]. It has been referenced in the literature that the expression of the spuABCDEFGH coexpressed when putrescine is catabolically used and, consequently, forms an operonic unit, or these genes are organized as different transcriptional units under the same regulatory mechanism [27]. This suggests that, at least in different pseudomonads, both cadaverine and putrescine are metabolized by the same pathway, being assimilated at a similar rate. However, the results presented here suggest a different behavior of P. putida U in the metabolism of cadaverine and putrescine. Based on that, a similar growth kinetic determination was performed, although with the addition of a low concentration of putrescine. The rationale for this was the assumption that, as indicated for P. aeruginosa, putrescine could act as an inducer of the expression of the entire degradation pathway [27]. The growth in cadaverine and DAVA using these conditions was faster, suggesting a faster induction of the degradative pathway by putrescine or GABA than by cadaverine or DAVA.
The first putrescine and cadaverine degradative process is carried out by amino oxidoreductase or aminotransferases. In P. aeruginosa, the proteins PauB1-4 and SpuC have been described as responsible for these initial deaminations. In P. putida G7, homologs of pauB were found, but we focused on the spuC genes since two spuC paralog genes were found, homologous to the only one described in P. aeruginosa as associated with the deamination of both putrescine and cadaverine [54]. These spuC genes showed different expression profiles triggered by different amines in P. putida U. spuC1 in P. putida U is more related to putrescine than cadaverine and is unrelated to GABA and DAVA, as inferred from the E. coli and P. aeruginosa pathways [17,21]. On the other hand, the fact that one spuC is upregulated specifically by putrescine could explain the slower growth in cadaverine mentioned earlier. However, the gene spuC2 seems to be exclusively induced in response to cadaverine and not to putrescine. Therefore, this would be the first evidence of a spuC1 induced by both amines and a spuC2 exclusive to cadaverine.
The existence of two spuC paralogs seems to be conserved in other P. putida strains, where the spu1 clusters resemble the spuABCDEFGH cluster of P. aeruginosa [27], with the transporter genes linked, suggesting a co-transcription of the spuC1 gene of P. putida and the spuDEFGH genes involved in polyamine transport. On the other hand, the possible spu2 cluster, when performing a homology analysis, shows us three genes: one that potentially would be spuC2 and the other two genes potentially participating in the ɣ-glutamyl-degrading mechanism (Figure 6). This could explain why putrescine allows faster growth than cadaverine, as putrescine increases the transporters by increasing the transcript of spuC1, which belongs to the spu1 cluster (Figure 5A). Regarding enzymatic activity, no differences were found between cadaverine and putrescine at some points of the pathway, as suggested in the literature [54]. Therefore, this growth delay is mainly due to gene induction and possibly less efficient transport of these transporters, where one of their periplasmic polyamine binding proteins, SpuF, could show a higher affinity for putrescine than cadaverine [51].
Furthermore, a study of gabT genes was conducted, as they are responsible for the first degradation step of the GABA and DAVA intermediates [17,24]. Through alignments, two gabTs paralogs were found, resembling what is indicated in the literature for E. coli [24,55]. The expression results in cadaverine, putrescine, DAVA, and GABA indicate that although the gabT1 gene is upregulated, gabT2 is not. Therefore, these results suggest that gabT1 could be an inducible gene, while gabT2 seems to show a constitutive expression, as described in E. coli [25]. However, it is still uncertain whether putrescine and cadaverine induce by themselves the expression of gabT genes or if the true inducer of some of the genes could be a catabolic intermediate (GABA and/or DAVA), unlike E. coli, where putrescine, but not GABA, has been indicated to be the inducer of the expression of gabT [25].
In P. putida G7, two degradative gene clusters can be identified. Cluster spu1 contains all the necessary genes for the transport, deamination, glutamylation, and aldehyde dehydrogenase required for amine degradation. However, it appears that this possible cluster is more strongly induced by putrescine than cadaverine in P. putida U. On the other hand, the second cluster, spu2, contains two genes involved in polyamine glutamylation and a gene encoding an aminotransferase (spuC2) that seems to be expressed only in response to cadaverine.
Finally, this work opens a path to improving cadaverine degradation by identifying specific genes for this polyamine, allowing the study of the enzymatic activity of these genes and potentially enhancing the degradative activity of cadaverine compared to genes induced by both polyamines.

5. Conclusions

P. putida U is a bacterium able to catabolize putrescine and cadaverine, as well as their intermediates GABA and DAVA, supporting its growth, as previously described in other organisms [17,18]. The known genetic sequences of P. putida U exhibit high identity with those from the P. putida G7 genome, enabling the design of oligonucleotide primers for the study of specific genes. This, in conjunction with the maintaining of specific genes in the P. aeruginosa PAO1 genome, suggests that although the canonical pathways are maintained in pseudomonads, some strain-specific modifications could occur in the catabolism of different polyamines.
Two different polyamine aminotransferases involved in the metabolism of putrescine and cadaverine have been identified in P. putida strain U. The gene spuC1 is expressed in the presence of both polyamines, while the gene spuC2 is only upregulated by cadaverine. This implicates a specific gene response involvement of spuC2 in cadaverine deamination.
In comparison to P. aeruginosa, where a single gene cluster responsible for the transport and catabolism of polyamines has been proposed [27], in P. putida, two distinct genetic clusters have been identified until now. The spu1 cluster contains a spuC1 gene, other genes related to γ-glutamylation, and a polyamine transport system that shows homology with the one described in P. aeruginosa. On the other hand, the spu2 cluster contains two genes involved in γ-glutamylation and the spuC2 gene, whose expression responds exclusively to the presence of cadaverine in P. putida U. The spuBCDEFGH operon from P. putida U is analogous to the one described in P. aeruginosa [26], except for the rearrangement in the genome of the spuA gene that is found in the spu2 cluster in P. putida (Figure 6).
These genetic differences between P. putida and P. aeruginosa suggest that P. putida has evolved a more complex strategy for polyamine metabolism, potentially influencing its degradative capacity and adaptation to different environmental conditions. The results here suggest that the study of the genes and their functions, as well as the arrangement of metabolic functions suggesting networking participation of paralog functions in a differential way depending on the polyamine to be catabolized in P. putida U, may provide a deeper understanding of bacterial polyamine degradation. However, we are conscious that more studies are necessary to establish the complex interactions of these pathways in our bacterial model; the potential results could help for a better understanding of the complexity of polyamine metabolism, with an impact on the food industry and the development of infection therapies.

Supplementary Materials

The following supporting information can be downloaded at https://www.mdpi.com/article/10.3390/genes14101897/s1. Figure S1: Alignment of the DNA sequences corresponding to the amplicons obtained in P. putida U by qPCR using the primers for spuC1, spuC2, gabT1, and gabT2 with the corresponding sequences from P. putida G7 genome (CP096581); Figure S2: Maximal growth reached by P. putida U, determined as absorbance at 540 nm, when growing in MM supplied with different polyamines, or derivatives, as sole carbon source. Figure S3: Phylogenetic analysis of the selected gabT1 and gabT2 gene sequences (A) and spuC genes (B) using the Maximum Likelihood method and Kimura-2 parameter model, using a bootstrapping of 1000. Bootstrap values of more than 50 are shown; Table S1: Identity percentages obtained from the alignment of 16S rRNA sequence from P. putida U against other P. putida strain sequences from GenBank (NCBI) showing that the higher identity was reached with P. putida G7; Table S2: Identities obtained through the alignment of the P. putida U DNA sequences present in the GenBank database against their orthologs from P. putida G7 and P. putida S13.1.2 genomes. Refs [56,57,58,59,60,61] have been cited in this file.

Author Contributions

Conceptualization E.R.O., L.G. and A.C.-A. Experiments achievement L.G. and A.C.-A. assisted by J.L.M. and E.R.O. Analysis and discussion of the results, as well as the manuscript writing J.M.L., E.R.O., C.B., L.G. and A.C.-A. All authors have read and agreed to the published version of the manuscript.

Funding

This research was funded by the Consejería de Educación (Junta de Castilla y León, Valladolid, Spain, grant LE250P20). L. Getino (L. G.) was supported by a scholarship awarded by Junta de Castilla y León (predoctoral scholarship; ORDEN EDU/556/2019, 5 June BOCyL).

Institutional Review Board Statement

Not applicable.

Informed Consent Statement

Not applicable.

Data Availability Statement

All relevant data are included in the manuscript and Supplementary Files. New sequences have been sent to GenBank (NCBI, Bethesda, USA).

Acknowledgments

Special thanks to: (i) the “ABERPLAS” of the Ministerio de Ciencia e Innovación of Spain (TED2021-132593B-100); (ii) the ESTELLA project (“DESign of bio-based Thermoset polymer with rEcycLing capabiLity by dynAmic bonds for bio-composite manufacturing”) (Project no.: 101058371) funded by the European Union through the Horizon Europe Framework Programme (call: HORIZON-CL4-2021-RESILIENCE-01-11), and (iii) the BioPac project (Development of bioactive and lifespan-controlled bioplastics) (Ref. no. TED2021-131864B-C21) funded by the MCIN (Ministerio de Ciencia e Innovación)/AEI (Agencia Estatal de Investigación)/10.13039/501100011033 (Digital Object Identifier) and the European Union “NextGenerationEU”/PRTR (Recovery, Transformation and Resilience Plan).

Conflicts of Interest

The authors declare no conflict of interest.

References

  1. Yousefi, H.; Su, H.M.; Imani, S.M.; Alkhaldi, K.; Filipe, C.D.M.; Didar, T.F. Intelligent food packaging: A review of smart sensing technologies for monitoring food quality. ACS Sens. 2019, 4, 808–821. [Google Scholar] [CrossRef] [PubMed]
  2. Ruiz-Capillas, C.; Herrero, A.M. Impact of biogenic amines on food quality and safety. Foods 2019, 8, 62. [Google Scholar] [CrossRef] [PubMed]
  3. Ovalle-Marmolejo, X.Y.; Redondo-Solano, M.; Granados-Chinchilla, F.; Miranda-Castilleja, D.E.; Arvizu-Medrano, S.M. Effect of stress factors on the production of biogenic amines by lactic acid bacteria isolated from fermented Mexican foods (cheese and beer). Food Control. 2023, 146, 109553. [Google Scholar] [CrossRef]
  4. Miguel, G.A.; Carlsen, S.; Arneborg, N.; Saerens, S.M.G.; Laulund, S.; Knudsen, G.M. Non-Saccharomyces yeasts for beer production: Insights into safety aspects and considerations. Int. J. Food Microbiol. 2022, 383, 109951. [Google Scholar] [CrossRef]
  5. Costantini, A.; Vaudano, E.; Pulcini, L.; Carafa, T.; Garcia-Moruno, E. An overview on biogenic amines in wine. Beverages 2019, 5, 19. [Google Scholar] [CrossRef]
  6. Moniente, M.; Botello-Morte, L.; Garcia-Gonzalo, D.; Pagan, R.; Ontanon, I. Analytical strategies for the determination of biogenic amines in dairy products. Compr. Rev. Food Sci. Food Saf. 2022, 21, 3612–3646. [Google Scholar] [CrossRef] [PubMed]
  7. Schirone, M.; Esposito, L.; D’Onofrio, F.; Visciano, P.; Martuscelli, M.; Mastrocola, D.; Paparella, A. Biogenic amines in meat and meat products: A review of the science and future perspectives. Foods 2022, 11, 788. [Google Scholar] [CrossRef]
  8. Santos, M.H.S. Biogenic amines: Their importance in foods. Int. J. Food Microbiol. 1996, 29, 213–231. [Google Scholar] [CrossRef]
  9. Gevrekci, A.Ö. The roles of polyamines in microorganisms. World J. Microbiol. Biotechnol. 2017, 33, 204. [Google Scholar] [CrossRef]
  10. Freudenberg, R.A.; Wittemeier, L.; Einhaus, A.; Baier, T.; Kruse, O. Advanced pathway engineering for phototrophic putrescine production. Plant Biotechnol. J. 2022, 20, 1968–1982. [Google Scholar] [CrossRef]
  11. Sagar, N.A.; Tarafdar, S.; Agarwal, S.; Tarafdar, A.; Sharma, S. Polyamines: Functions, metabolism, and role in human disease management. Med. Sci. 2021, 9, 44. [Google Scholar] [CrossRef] [PubMed]
  12. Cohen, S.S. A Guide to the Polyamines; Oxford University Press: Oxford, UK, 1998. [Google Scholar]
  13. Young, C.C.; Chen, L.F. Polyamines in humic acid and their effect on radical growth of lettuce seedlings. Plant Soil 1997, 195, 143–149. [Google Scholar] [CrossRef]
  14. Wojcik, W.; Lukasiewicz, M.; Puppel, K. Biogenic amines: Formation, action and toxicity—A review. J. Sci. Food Agric. 2021, 101, 2634–2640. [Google Scholar] [CrossRef] [PubMed]
  15. Omer, A.K.; Mohammed, R.R.; Ameen, P.S.M.; Abas, Z.A.; Ekici, K. Presence of biogenic amines in food and their public health implications: A review. J. Food Prot. 2021, 84, 1539–1548. [Google Scholar] [CrossRef]
  16. Krysenko, S.; Wohlleben, W. Polyamine and ethanolamine metabolism in bacteria as an important component of nitrogen assimilation for survival and pathogenicity. Med. Sci. 2022, 10, 40. [Google Scholar] [CrossRef]
  17. Luengo, J.M.; Olivera, E.R. Catabolism of biogenic amines in Pseudomonas species. Environ. Microbiol. 2020, 22, 1174–1192. [Google Scholar] [CrossRef]
  18. Krysenko, S.; Matthews, A.; Busche, T.; Bera, A.; Wohlleben, W. Poly- and monoamine metabolism in Streptomyces coelicolor: The new role of glutamine synthetase-like enzymes in the survival under environmental stress. Microb. Physiol. 2021, 31, 233–247. [Google Scholar] [CrossRef]
  19. Ramakrishna, S.; Guarino, L.; Cohen, S.S. Polyamines of Anacystis nidulans and metabolism of exogenous spermidine and spermine. J. Bacteriol. 1978, 134, 744–750. [Google Scholar] [CrossRef]
  20. Samsonova, N.N.; Smirnov, S.V.; Altman, I.B.; Ptitsyn, L.R. Molecular cloning and characterization of Escherichia coli K12 ygjG gene. BMC Microbiol. 2003, 3, 2. [Google Scholar] [CrossRef]
  21. Samsonova, N.N.; Smirnov, S.V.; Novikova, A.E.; Ptitsyn, L.R. Identification of Escherichia coli K12 YdcW protein as a γ-aminobutyraldehyde dehydrogenase. FEBS Lett. 2005, 579, 4107–4112. [Google Scholar] [CrossRef]
  22. Kurihara, S.; Oda, S.; Kato, K.; Kim, H.G.; Koyanagi, T.; Kumagai, H.; Suzuki, H. A novel putrescine utilization pathway involves γ-glutamylated intermediates of Escherichia coli K-12. J. Biol. Chem. 2005, 280, 4602–4608. [Google Scholar] [CrossRef]
  23. Suzuki, H.; Kurihara, S. Polyamine catabolism in prokaryotes. In Polyamines; Springer: Tokyo, Japan, 2015; pp. 47–59. [Google Scholar]
  24. Schneider, B.L.; Reitzer, L. Pathway and enzyme redundancy in putrescine catabolism in Escherichia coli. J. Bacteriol. 2012, 194, 4080–4088. [Google Scholar] [CrossRef] [PubMed]
  25. Kurihara, S.; Kato, K.; Asada, K.; Kumagai, H.; Suzuki, H. A putrescine-inducible pathway comprising PuuE-YneI in which γ-aminobutyrate is degraded into succinate in Escherichia coli K-12. J. Bacteriol. 2010, 192, 4582–4591. [Google Scholar] [CrossRef] [PubMed]
  26. Lu, C.D.; Itoh, Y.; Nakada, Y.; Jiang, Y. Functional analysis and regulation of the divergent spuABCDEFGH-spuI operons for polyamine uptake and utilization in Pseudomonas aeruginosa PAO1. J. Bacteriol. 2002, 184, 3765–3773. [Google Scholar] [CrossRef] [PubMed]
  27. Chou, H.T.; Kwon, D.H.; Hegazy, M.; Lu, C.D. Transcriptome analysis of agmatine and putrescine catabolism in Pseudomonas aeruginosa PAO1. J. Bacteriol. 2008, 190, 1966–1975. [Google Scholar] [CrossRef]
  28. Yao, X.; He, W.; Lu, C.-D. Functional characterization of seven γ-glutamylpolyamine synthetase genes and the bauRABCD locus for polyamine and β-alanine utilization in Pseudomonas aeruginosa PAO1. J. Bacteriol. 2011, 193, 3923–3930. [Google Scholar] [CrossRef]
  29. Chou, H.T.; Li, J.Y.; Peng, Y.C.; Lu, C.D. Molecular characterization of PauR and its role in control of putrescine and cadaverine catabolism through the γ-glutamylation pathway in Pseudomonas aeruginosa PAO1. J. Bacteriol. 2013, 195, 3906–3913. [Google Scholar] [CrossRef]
  30. Arcos, M.; Olivera, E.R.; Arias, S.; Naharro, G.; Luengo, J.M. The 3,4-dihydroxyphenylacetic acid catabolon, a catabolic unit for degradation of biogenic amines tyramine and dopamine in Pseudomonas putida U. Environ. Microbiol. 2010, 12, 1684–1704. [Google Scholar] [CrossRef]
  31. Arias, S.; Olivera, E.R.; Arcos, M.; Naharro, G.; Luengo, J.M. Genetic analyses and molecular characterization of the pathways involved in the conversion of 2-phenylethylamine and 2-phenylethanol into phenylacetic acid in Pseudomonas putida U. Environ. Microbiol. 2008, 10, 413–432. [Google Scholar] [CrossRef]
  32. de la Torre, M.; Gómez-Botrán, J.L.; Olivera, E.R.; Bermejo, F.; Rodríguez-Morán, J.; Luengo, J.M. Histamine catabolism in Pseudomonas putida U: Identification of the genes, catabolic enzymes and regulators. Environ. Microbiol. 2018, 20, 1828–1841. [Google Scholar] [CrossRef]
  33. Bertani, G. Studies on lysogenesis I. J. Bacteriol. 1951, 62, 293–300. [Google Scholar] [CrossRef] [PubMed]
  34. Martínez-Blanco, H.; Reglero, A.; Rodriguez-Aparicio, L.B.; Luengo, J.M. Purification and biochemical characterization of phenylacetyl-CoA ligase from Pseudomonas putida. A specific enzyme for the catabolism of phenylacetic acid. J. Biol. Chem. 1990, 265, 7084–7090. [Google Scholar] [CrossRef] [PubMed]
  35. Hall, T.A. BioEdit: A user-friendly biological sequence alignment editor and analysis program for Windows 95/98/NT. Nucleic Acids Symp. Ser. 1999, 41, 95–98. [Google Scholar]
  36. Kumar, S.; Stecher, G.; Li, M.; Knyaz, C.; Tamura, K. Mega X: Molecular evolutionary genetics analysis across computing platforms. Mol. Biol. Evol. 2018, 35, 1547–1549. [Google Scholar] [CrossRef]
  37. Tamura, K.; Stecher, G.; Kumar, S. MEGA11: Molecular evolutionary genetics analysis version 11. Mol. Biol. Evol. 2021, 38, 3022–3027. [Google Scholar] [CrossRef]
  38. Sievers, F.; Wilm, A.; Dineen, D.; Gibson, T.J.; Karplus, K.; Li, W.Z.; Lopez, R.; McWilliam, H.; Remmert, M.; Soding, J.; et al. Fast, scalable generation of high-quality protein multiple sequence alignments using Clustal Omega. Mol. Syst. Biol. 2011, 7, 539. [Google Scholar] [CrossRef] [PubMed]
  39. Saitou, N.; Nei, M. The neighbor-joining method: A new method for reconstructing phylogenetic trees. Mol. Biol. Evol. 1987, 4, 406–425. [Google Scholar] [CrossRef]
  40. Kimura, M. A simple method for estimating evolutionary rates of base substitutions through comparative studies of nucleotide sequences. J. Mol. Evol. 1980, 16, 111–120. [Google Scholar] [CrossRef]
  41. Saitou, N. Property and efficiency of the maximum likelihood method for molecular phylogeny. J. Mol. Evol. 1988, 27, 261–273. [Google Scholar] [CrossRef]
  42. Felsenstein, J. Confidence limits on phylogenies: An approach using the bootstrap. Evolution 1985, 39, 783–791. [Google Scholar] [CrossRef]
  43. Cardoza, R.E.; McCormick, S.P.; Lindo, L.; Kim, H.S.; Olivera, E.R.; Nelson, D.R.; Proctor, R.H.; Gutierrez, S. A cytochrome P450 monooxygenase gene required for biosynthesis of the trichothecene toxin harzianum A in Trichoderma. Appl. Microbiol. Biotechnol. 2019, 103, 8087–8103. [Google Scholar] [CrossRef] [PubMed]
  44. Lindo, L.; Cardoza, R.E.; Lorenzana, A.; Casquero, P.A.; Gutierrez, S. Identification of plant genes putatively involved in the perception of fungal ergosterol-squalene. J. Integr. Plant Biol. 2020, 62, 927–947. [Google Scholar] [CrossRef] [PubMed]
  45. Girard, L.; Lood, C.; Rokni-Zadeh, H.; van Noort, V.; Lavigne, R.; De Mot, R. Reliable identification of environmental Pseudomonas isolates using the rpoD gene. Microorganisms 2020, 8, 1166. [Google Scholar] [CrossRef] [PubMed]
  46. Pazos-Rojas, L.A.; Munoz-Arenas, L.C.; Rodriguez-Andrade, O.; Lopez-Cruz, L.E.; Lopez-Ortega, O.; Lopes-Olivares, F.; Luna-Suarez, S.; Baez, A.; Morales-Garcia, Y.E.; Quintero-Hernandez, V.; et al. Desiccation-induced viable but nonculturable state in Pseudomonas putida KT2440, a survival strategy. PLoS ONE 2019, 14, e0219554. [Google Scholar] [CrossRef] [PubMed]
  47. Livak, K.J.; Schmittgen, T.D. Analysis of relative gene expression data using real-time quantitative PCR and the 2−ΔΔCT method. Methods 2001, 25, 402–408. [Google Scholar] [CrossRef]
  48. Hanahan, D. Studies on transformation of Escherichia coli with plasmids. J. Mol. Biol. 1983, 166, 557–580. [Google Scholar] [CrossRef]
  49. Galman, J.L.; Gahloth, D.; Parmeggiani, F.; Slabu, I.; Leys, D.; Turner, N.J. Characterization of a putrescine transaminase from Pseudomonas putida and its application to the synthesis of benzylamine derivatives. Front. Bioeng. Biotechnol. 2018, 6, 205. [Google Scholar] [CrossRef]
  50. Hasne, M.P.; Coppens, I.; Soysa, R.; Ullman, B. A high-affinity putrescine-cadaverine transporter from Trypanosoma cruzi. Mol. Microbiol. 2010, 76, 78–91. [Google Scholar] [CrossRef]
  51. Kroger, P.; Shanmugaratnam, S.; Ferruz, N.; Schweimer, K.; Hocker, B. A comprehensive binding study illustrates ligand recognition in the periplasmic binding protein PotF. Structure 2021, 29, 433.e4. [Google Scholar] [CrossRef]
  52. Szalai, G.; Janda, K.; Darko, E.; Janda, T.; Peeva, V.; Pal, M. Comparative analysis of polyamine metabolism in wheat and maize plants. Plant Physiol. Biochem. 2017, 112, 239–250. [Google Scholar] [CrossRef]
  53. Shelp, B.J.; Bozzo, G.G.; Trobacher, C.P.; Zarei, A.; Deyman, K.L.; Brikis, C.J. Hypothesis/review: Contribution of putrescine to 4-aminobutyrate (GABA) production in response to abiotic stress. Plant Sci. 2012, 193, 130–135. [Google Scholar] [CrossRef] [PubMed]
  54. Galman, J.L.; Slabu, I.; Weise, N.J.; Iglesias, C.; Parmeggiani, F.; Lloyd, R.C.; Turner, N.J. Biocatalytic transamination with near-stoichiometric inexpensive amine donors mediated by bifunctional mono- and di-amine transaminases. Green Chem. 2017, 19, 361–366. [Google Scholar] [CrossRef]
  55. Yu, P.; Ren, Q.; Wang, X.X.; Huang, X.X. Enhanced biosynthesis of gamma-aminobutyric acid (GABA) in Escherichia coli by pathway engineering. Biochem. Eng. J. 2019, 141, 252–258. [Google Scholar] [CrossRef]
  56. Arias-Barrau, E.; Sandoval, A.; Naharro, G.; Olivera, E.R.; Luengo, J.M. A two-component hydroxylase involved in the assimilation of 3-hydroxyphenyl acetate in Pseudomonas putida. J. Biol. Chem. 2005, 280, 26435–26447. [Google Scholar] [CrossRef]
  57. Merino, E.; Barrientos, A.; Rodriguez, J.; Naharro, G.; Luengo, J.M.; Olivera, E.R. Isolation of cholesterol- and deoxycholate-degrading bacteria from soil samples: Evidence of a common pathway. Appl. Microbiol. Biotechnol. 2013, 97, 891–904. [Google Scholar] [CrossRef]
  58. Olivera, E.R.; Minambres, B.; Garcia, B.; Muniz, C.; Moreno, M.A.; Ferrandez, A.; Diaz, E.; Garcia, J.L.; Luengo, J.M. Molecular characterization of the phenylacetic acid catabolic pathway in Pseudomonas putida U: The phenylacetyl-CoA catabolon. Proc. Natl. Acad. Sci. USA 1998, 95, 6419–6424. [Google Scholar] [CrossRef]
  59. Garcia, B.; Olivera, E.R.; Minambres, B.; Fernandez-Valverde, M.; Canedo, L.M.; Prieto, M.A.; Garcia, J.L.; Martinez, M.; Luengo, J.M. Novel biodegradable aromatic plastics from a bacterial source: Genetic and biochemical studies on a route of the phenylacetyl-CoA catabolon. J. Biol. Chem. 1999, 274, 29228–29241. [Google Scholar] [CrossRef]
  60. Arias-Barrau, E.; Olivera, E.R.; Luengo, J.M.; Fernandez, C.; Galan, B.; Garcia, J.L.; Diaz, E.; Minambres, B. The homogentisate pathway: A central catabolic pathway involved in the degradation of L-phenylalanine, L-tyrosine, and 3-hydroxyphenylacetate in Pseudomonas putida. J. Bacteriol. 2004, 186, 5062–5077. [Google Scholar] [CrossRef]
  61. Olivera, E.R.; Carnicero, D.; Garcia, B.; Minambres, B.; Moreno, M.A.; Canedo, L.; DiRusso, C.C.; Naharro, G.; Luengo, J.M. Two different pathways are involved in the beta-oxidation of n-alkanoic and n-phenylalkanoic acids in Pseudomonas putida U: Genetic studies and biotechnological applications. Mol. Microbiol. 2001, 39, 863–874. [Google Scholar] [CrossRef]
Figure 1. Direct and γ-glutamylation pathway for putrescine and cadaverine catabolism. E. coli proteins are marked in blue, P. aeruginosa proteins in red, and those homolog proteins present in both bacteria are written in black color. Enzymes: SpuD (putrescine-binding periplasmic protein); SpuE (spermidine-binding periplasmic protein); SpuF/PotG (spermidine/putrescine import ATP-binding protein); SpuG/PotH (polyamine transport protein); SpuH/PotI (polyamine transport protein); PuuP (putrescine importer); SpuC (putrescine:pyruvate aminotransferase); YgjG (putrescine aminotransferase); KauB (4-guanidinobutyraldehyde dehydrogenase); YdcW (γ-aminobutyraldehyde dehydrogenase); PauA (glutamine synthetase); PauB (g-glutamyl-polyamine oxidoreductase); PauC (aldehyde dehydrogenase); PauD (glutamine amidotransferase); PuuA (γ-glutamylputrescine synthetase); PuuB (γ-glutamyl-polyamine oxidoreductase); PuuC (NADP/NAD-dependent aldehyde dehydrogenase); PuuD (γ-glutamyl-γ-aminobutyrate hydrolase); GabT/DavT (γ-aminobutyrate aminotransferase/δ-aminovalerate aminotransferase); GabD/DavD (succinate-semialdehyde dehydrogenase [NADP(+)]/glutarate-semialdehyde dehydrogenase). Glu (Glutamate); when n = 4 (I) putrescine, (II) γ-glutamylputrescine (III) γ aminobutyraldehyde, (IV) γ glutamyl aminobutyraldehyde; (V) γ-glutamylaminobutyric acid; (VI) γ-aminobutyric acid; (VII) succinic semialdehyde; (VIII) succinic acid; whereas n = 5 (I) cadaverine; (II) δ-glutamylcadaverine; (III) δ-aminovaleraldehyde; (IV) δ-glutamylaminovaleraldehyde; (V) δ-glutamylaminovaleric acid; (VI) δ-aminovaleric; (VII) glutarate semialdehyde (VIII) glutarate.
Genes 14 01897 g001
Figure 2. Growth of P. putida U determined as the increase in absorbance at 540 nm, in MM supplied with (A) citrate (♦), putrescine (○), and GABA (□) 10 mM; (B) citrate (♦), cadaverine (Δ), and DAVA (▽) 10 mM; (C) citrate (♦), putrescine (○) 10 mM, and putrescine (●) 1 mM; (D) putrescine 1 mM (♦) and GABA 10 mM with (■) and without (□) 1 mM of putrescine; (E) putrescine 1 mM (♦) and cadaverine 10 mM with (▲) and without (Δ) 1 mM of putrescine; (F) putrescine 1 mM (♦) and DAVA 10 mM with (▼) and without (▽) 1 mM of putrescine. Means and standard deviations (n = 3) are indicated in the growth curves. The maximum absorbance achieved for the different carbon sources is shown in Supplementary Figure S2.
Genes 14 01897 g002
Figure 3. Neighbor-joining phylogenetic tree (1000 bootstrap replications) constructed using the DNA coding sequences from documented GabT proteins, as well as those found in genomes potentially close to P. putida U (A), and SpuC published in other microbiological systems and also identified in the genomes used as homologous to P. putida U (B). The tree scale (0.02) represents evolutionary distances in units of base substitutions per site as computed by the Kimura-2 parameter method. Bootstrap values of more than 50 are shown. Gaps were managed as easily paired deleted during tree construction. Trees constructed using the Maximum Likelihood method with similar bootstrapping of 1000 replicates showed a similar topology (Supplementary Figure S3). Paralog genes from P. putida strain G7 are indicated in red.
Genes 14 01897 g003
Figure 4. Relative position in the P. putida G7 genome of the genes used in the qPCR analysis. From a–g are the positions of the B-pannel genes in the P. putida G7 genome (A), and relative position of the optimal primers used for these studies (B). In (C), amplicons obtained through the qPCR were identified based on their mobility and size determined in an agarose gel (2.5%), and later, their sequence was determined through Sanger sequencing (Supplementary Figure S1). In the gel, MwM, molecular weight markers; 1. recA amplicon; 2. rpoD amplicon; 3. rpoN amplicon; 4. spuC1 amplicon; 5. spuC2 amplicon; 6. gabT1 amplicon; 7. gabT2 amplicon.
Genes 14 01897 g004
Figure 5. Fold change of expression of spuC1 (A), spuC2 (B), gabT1 (C), and gabT2 (D) genes analyzed when P. putida U was cultured in citrate (blue), putrescine (red), GABA (green), cadaverine (purple), or DAVA (orange) at 10 mM as sole carbon and energy source. Values are means ± standard deviation (SD) (n = 4). Statistical significance was determined with ANOVA for citrate; * is p < 0.05.
Genes 14 01897 g005
Figure 6. Schematic representation of the spu cluster of genes and in P. aeruginosa PAO1 and P. putida G7 showing the genetic rearrangements between both strains. Orange color indicates genes putatively involved in the uptake of polyamines, whereas blue color indicates genes whose products participate in polyamine catabolic processes. Yellow color (spuI genes) indicates genes that putatively encoded glutamine synthetase-like proteins that, although in the literature about catabolism of polyamines in Pseudomonas have been suggested as participants in the polyamine catabolic process, Krysenko et al. demonstrated, in S. coelicolor, their participation in γ-glutamylation of polyamines and other monoamines [18]. Red lines indicate the genetic rearrangements affecting genes in both bacteria, evidencing the presence of some paralog genes in P. putida G7. NOTE: During the processing of this article, authors have confirmed through PCR amplification using degenerate primers designed based on the genome of P. putida G7, the maintaining of the synteny to the corresponding genes between G7 strain genes and those present in the genome of P. putida U (data not shown).
Genes 14 01897 g006
Table 1. Oligonucleotide primers designed, and their main characteristics, used for the analysis of differential expression of some genes in P. putida in response to polyamines or catabolic derivatives from them. The annealing temperature used for all of them was 60 °C.
OligonucleotideTarget GeneSequence (5’–3’)Amplicon Size (bp)Efficiency (%)R2 of Efficiencies
Q-SpuC1,1-5′ PPUspuC1AAGCCGCACAAGCAGACCAT132 pb96.590.990
Q-SpuC1,1-3′ PPUGATGTGCACGATGCCCGGAA
Q-SpuC2,1-5′ PPUspuC2CCAAGGGCGTGTACCTGTGG122 pb95.200.986
Q-SpuC2,1-3′ PPUCATCTGCTGGCTGGCAACCT
F1.gabT1.PPUgabT1GCTGTTGGCCAGGTTGTTGC144 pb98.820.998
R1.gabT1.PPUCAGTGCGTCTTCGGCAGTCA
F1.gabT2.PPUgabT2CGCCATCGTTCACCCGATCA120 pb93.920.992
R1.gabT2.PPUTTGCAGTGGCCCAGGTTGAG
F1.rpoD.PPUrpoDGCGAACCTGCGTCTGGTGAT138 pb96.140.997
R1.rpoD.PPUGAACTTGTAGCCGCGACGGT
F1.rpoN.PPUrpoNTCGAACCCGATGCTCGAACG109 pb101.010.994
R1.rpoN.PPUAGCTGTTGTCCTGGGCTTCG
F1.recA.PPUrecAGGCGAACAGGCCCTGGAAAT107 pb99.420.988
R1.recA.PPUCCTTCGATCTCGGCCTTGGG
Disclaimer/Publisher’s Note: The statements, opinions and data contained in all publications are solely those of the individual author(s) and contributor(s) and not of MDPI and/or the editor(s). MDPI and/or the editor(s) disclaim responsibility for any injury to people or property resulting from any ideas, methods, instructions or products referred to in the content.

