A KPI (Key Performance Indicator) is a graphical representation that displays progress against a predefined measure or business goal. KPIs make it easier for end users to evaluate the amount of progress without reading a bunch of data.
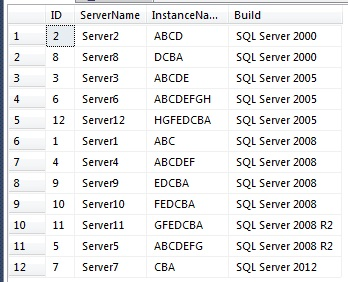
We will use the sample data (see below) I used in the previous post to create our KPI (this data is static since we imported it into Sharepoint as a separate list, so it will not report real time data)
Let’s say, for example, our DBA Manager wants to upgrade all the SQL Servers to at least SQL Server 2008 R2 and wants to know how many SQL Servers are not compliant. This is a good scenario for using a KPI to display this data.
Creating the KPI
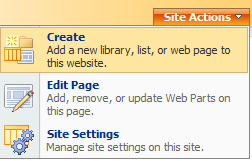
In Sharepoint, browse to the page where you want the KPI displayed and go to Site Actions > Create:
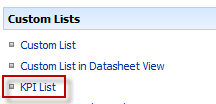
Custom Lists > KPI List:
For this example, I’ll create a list called SQL Versions KPI:
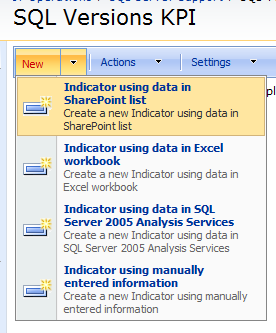
Once, the KPI list is created you should see a blank list. To add a KPI, click New > Indicator using data in Sharepoint list (you can also use other data sources for KPI’s):
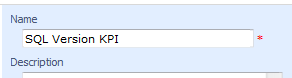
First, give the KPI a name: