Get the Insights Your Nonprofit Needs
using Google Analytics
In this guide you’ll learn how to
- Analyze your nonprofit’s website traffic
- See where your users are coming from
- See what actions users are taking on your site
- Measure the success of your marketing campaigns

Google Analytics is a free web analytics tool that can help you analyze your website traffic and measure the effectiveness of your marketing efforts. It can help nonprofits optimize their website to turn their traffic into donations, event registrations, or volunteer applications.
By using Google Analytics, your nonprofit can measure return on investment, identify which strategy yielded the most results and understand what content is performing best. Data can also help inform staffing decisions, which is incredibly valuable for nonprofits who are often resource constrained.
Get the most out of Google Analytics, by linking your Ad Grants account
Your Google Ad Grants account
Make sure that you’re using a Google Account that has Administrative access to your Ad Grants account. If you have not yet activated Ad Grants for your nonprofit, you will need to complete that process before you can link the account to Analytics. Please refer to the Ad Grants activation guide for specific instructions on getting pre-qualified and setting up your account.
To Link your Ad Grants account to Google Analytics
Linking your Google Ad Grants account to your Analytics lets you see the full customer cycle, from how they interact with your marketing to how they finally complete the goals you’ve set for them on your site (donate, volunteer etc).

Fundamentals of Google Analytics
Before digging into Google Analytics data, ask yourself what you are looking for and what you need to know, based on your nonprofit’s needs. For example, it might be helpful for you to learn about how your users are engaging with your site - are people signing up to volunteer or are they donating online? Are your landing pages relevant for your users? Analyzing your website traffic helps inform your online marketing by identifying what content is working well and engaging your users to complete desired actions. Let’s look at some of the top questions that nonprofits like you might have.
SOME USEFUL DEFINITIONS BEFORE GETTING STARTED
| Interaction | Interactions can include pageviews, events, or ecommerce transactions. For example, registering to become a volunteer, or purchasing a ticket to an event. | ||||||||
| Session | Interactions are grouped into sessions. By default, a session ends after 30 minutes of inactivity. If Google Analytics stops receiving hits for a period of time longer than the timeout length, the session ends. | ||||||||
| User | Google Analytics can recognize if multiple sessions are from the same user because of the Google Analytics cookie in the user’s browser. | ||||||||
| Source | The origin of your traffic, such as a search engine (for example, Google) or a domain (example.com). | ||||||||
| Medium | The general category of the source, for example, organic search (organic), cost-per-click paid search (cpc), web referral (referral). | ||||||||

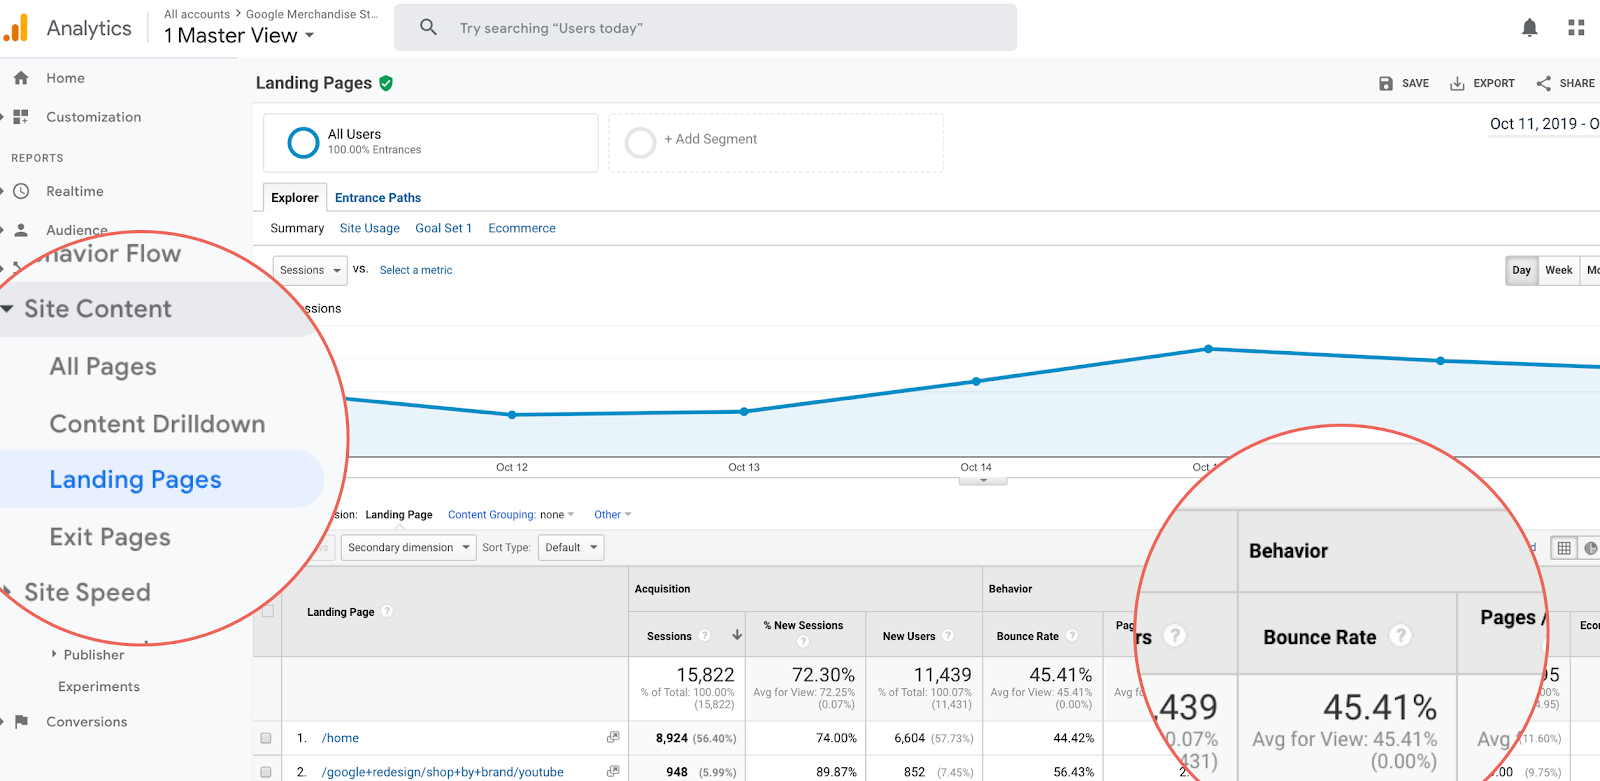
Are my landing pages relevant?
Your landing page (the first web page a user sees when they click on your domain) should match the expectation set by any marketing you use and should have engaging content that offers users easy paths to the next steps you want them to take. Using Analytics, you can analyze which pages on your site are the most engaging for your users. Try to incorporate design and content elements from successful pages throughout your site.
If the success of your site depends on users viewing more than one page, then a high bounce rate is not good. Examine if your content relates well with the marketing you use to drive users to those pages and if those pages offer a clear navigation path. Both “pages/session” viewed and “average session duration” are useful metrics for content engagement analysis.
A bounce is a single-page session on your site. In Analytics, a bounce is calculated as a session that triggers only a single request to the Analytics server, such as when a user opens a single page on your site.
Bounce Rate is the percentage of all sessions on your site which users viewed only a single page.

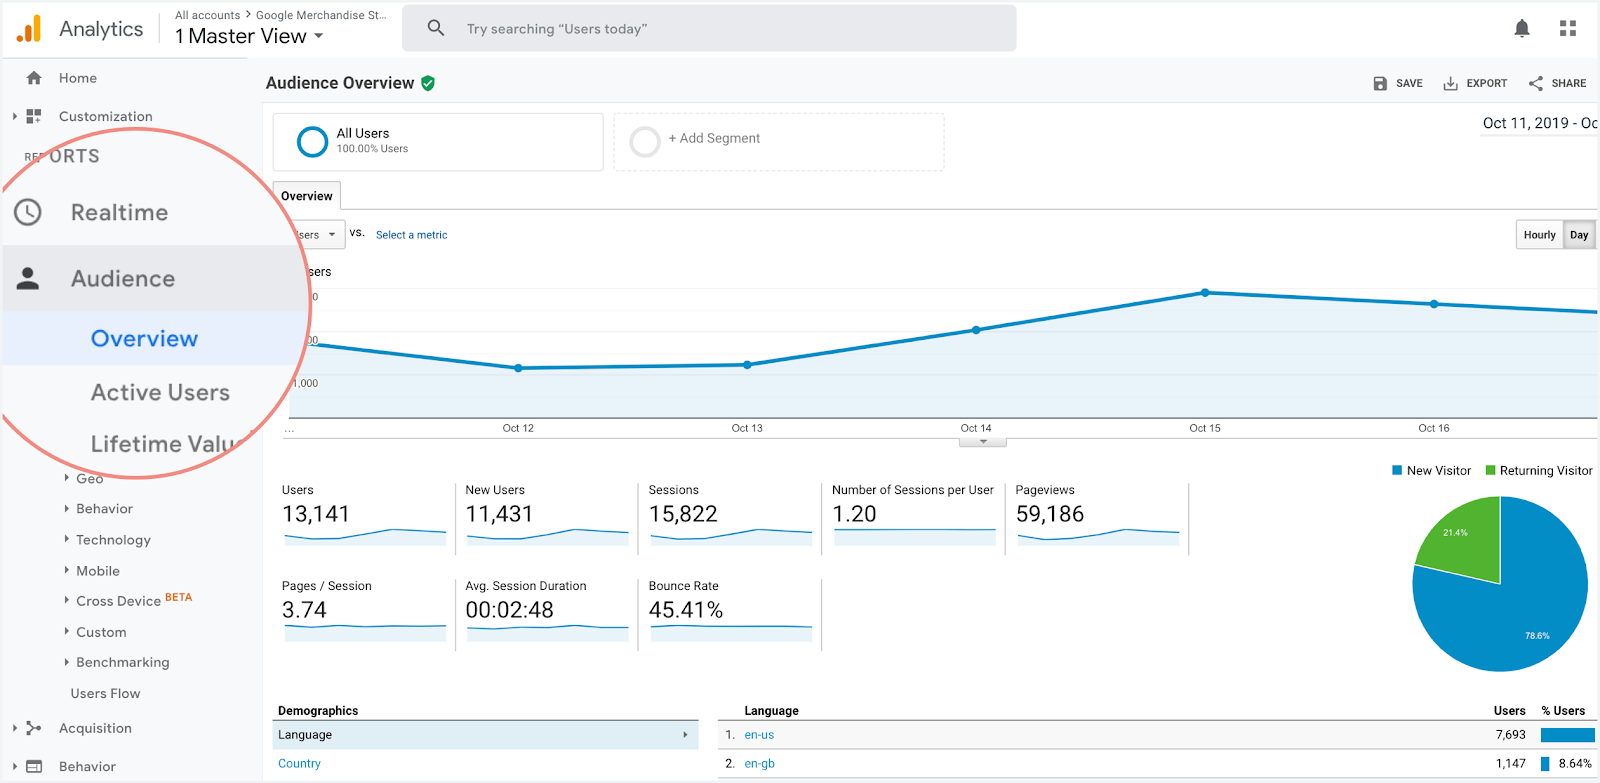
See where your users are coming from
While you might operate a small organization locally, you could be surprised that people farther away are supportive of your cause. 31% of donors worldwide give to NPOs and NGOs outside of their country of residence and 55% of Millenials prefer to give online*. Online giving technology, combined with access to a 24/7 global news cycle and more affordable international travel has led to an increase in donors with an empathetic worldview. Your website has the opportunity to reach global supporters and understanding where your users are coming from can help you to better tailor your marketing and communications to their needs.
WHO ARE MY USERS?
Click here to learn more about creating audiences in Analytics!

See what actions users are taking on your site
There are a multitude of things you can and should be tracking for user behavior on your site. You might have a place on your website for people to make donations or perhaps a sign-up form for people to register as a volunteer. For these key behaviours, it’s helpful to understand where the users came from. Were they directed to your site from a Google search, an email campaign, or a social post? Analyzing the behaviour against where the users came from provides insights to which of your communications are performing most effectively.
YOUR NONPROFIT’S FOUNDER IS SPEAKING AT AN EVENT. IS THIS BRINGING VISITORS TO YOUR WEBSITE?
- The Real-Time Overview shows the top-ten pages on which users are currently active, the source for the users on each page, and the number of active users on each page. If you are running a 1-day campaign (for example, to promote the founder’s event), you can see how many active users were referred by that campaign, whether they are coming in through the appropriate landing page(s) and their geographic locations.
- Use the Real-Time locations report to see the geographic locations of your active users. You can also see how many pages/screens were viewed from each city during the past 30 mins.
- The Top Social Traffic section uses the same social referral groupings that are used in the Social Reports. This allows you to see all the social networks that refer traffic.
- Use the Real-Time Content/Screens report to see which pages/screens have been viewed during the past 30 minutes. For example, you can see whether content you posted today is popular!

ARE PEOPLE SIGNING UP TO VOLUNTEER, OR ARE THEY DONATING ONLINE?
- A conversion is a completed activity that is important to your nonprofit. A conversion can be a macro conversion or a micro conversion.
- A macro conversion is typically a completed transaction - a donation, or volunteer registration.
- A micro conversion is a completed activity that indicates that the user is moving towards a macro conversion - visit the contact page, or visit the volunteering page.
- In Analytics, you can use goals to measure how often users complete specific actions. A goal represents a completed activity (a conversion), that contributes to the success of your organization.
- Goals can be applied to specific pages or screens your users visit, how many pages/screens they view in a session, how long they stay on your site or app, and the events they trigger while they are there. Goals fall into one of four types, listed in the table below.

| Goal Type | Description | Example |
|---|---|---|
| Destination | A specific location loads | Thank you web page or app screen |
| Duration | Sessions that last a specific amount of time or longer | 10 minutes or longer spent on a FAQs site |
| Pages/Screens per session | A user views a specific number of pages or screens | Five pages or screens have been loaded |
| Event | An action defined as an Event is triggered | Social recommendation, video play, form submission or resource download |
HOW MANY VOLUNTEERS SIGNED UP TO RECEIVE EMAIL ABOUT VOLUNTEERING OPPORTUNITIES?
- When you create a destination goal, you also have the option to create a funnel for that goal.
- A funnel refers to the path your users take to reach a particular destination. You can specify the screens or pages the user must visit prior to the final destination goal by turning on the Funnel option. This helps you identify specific drop-off points where you’re losing users on the journey or identify potential areas to further optimize your content on those pages.


Measure the success of your email campaigns
With Google Analytics, you can easily see which emails are performing better than others and if some generate more donations or sign-ups than others. This allows you to better tailor your email campaigns and other ongoing marketing efforts to focus on those channels that engage your supporters and work most effectively for your Nonprofit.
FIRST, MAKE SURE YOU KNOW WHAT SUCCESSFUL MEANS
SECOND, TELL ANALYTICS ABOUT YOUR EMAIL CAMPAIGNS

Click here to learn more about generating custom URLs for your campaigns

Measure the value of your site with Ecommerce tracking
While it’s important to learn who is donating, you likely also want to track how much people are donating. The Ecommerce reports allow you to analyze transaction activity on your site, whether it is donations or purchases. You can see transaction information, average donation value, conversion rate, time to purchase/donate, and other data. You may learn that people of a certain demographic, a particular time of day or elements of your marketing mix consistently result in donations of a higher value, so you may want to prioritize your marketing resources in certain areas more likely to achieve a higher return.
HOW MUCH DID PEOPLE DONATE ONLINE?
- If you are using a donations platform, some of them also have easy integrations with Google Analytics.
- If you are not using a donations platform, talk to your webmaster to implement ecommerce tracking on your website, or enhanced ecommerce for even more detail.
Click here for detailed instructions to set up Ecommerce Tracking
*TOP TIP*
Import your Analytics goals and transactions into Google Ads Conversion Tracking to view Analytics metrics - like Bounce Rate, Avg Session Duration and Pages/Session - on your Google Ads Campaigns and Ad Groups tabs. To learn how, read adding Analytics data to Google Ads reports.